HelloGrowthCRM software
Built for real small-business sales teams
HelloGrowthCRM helps reps qualify faster, follow up on time, and close more deals—with practical automation in one place.
- AI lead scoring and pipeline visibility
- Built-in dialer, WhatsApp, and email automation
- Sales forecasting and RevOps-ready reporting
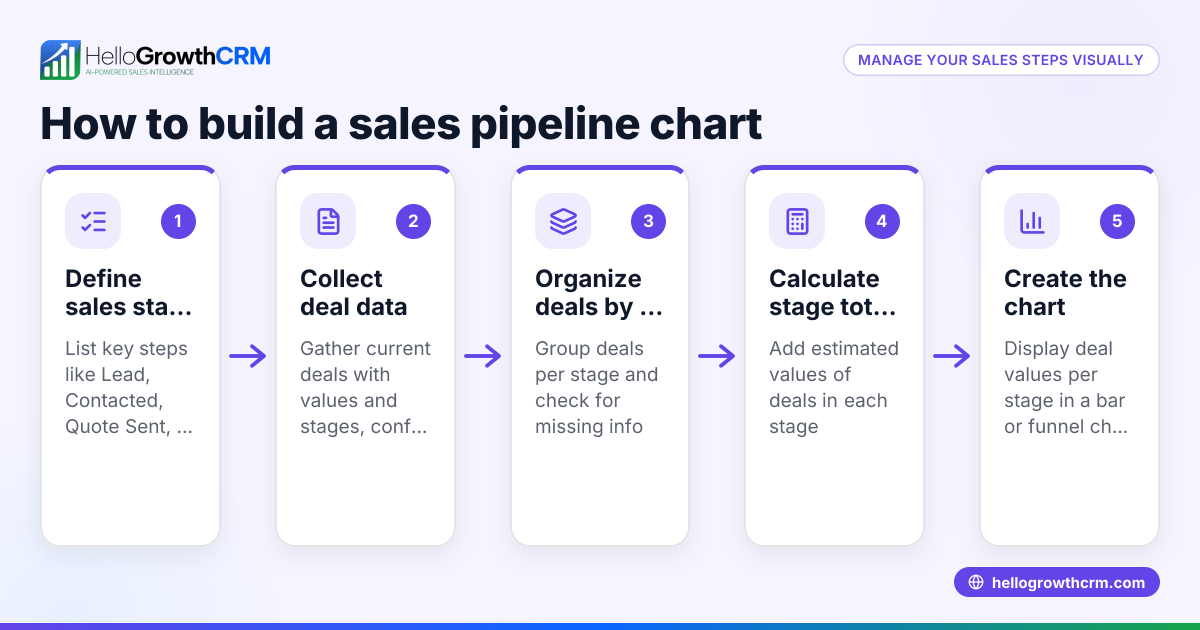
CRM charts are visual representations within customer relationship management software that help small businesses track sales data, lead status, and team performance at a glance. They convert raw data into bar charts, funnel diagrams, line graphs, or pie charts, enabling you to spot trends, identify bottlenecks, and forecast revenue more effectively.
Why this comes up / what goes wrong
Small business owners often search for CRM charts when they struggle to manage sales leads and pipelines using spreadsheets, emails, or text messages. Without clear visualizations, it becomes difficult to know which deals are stuck, how many leads entered the pipeline in a given period, or which sales reps perform best. This lack of insight leads to slow follow-up, lost sales opportunities, and inaccurate forecasting. When evaluating CRM software, owners want charts that are clear, customizable, update in real time, and integrate with their sales workflow.
Step-by-step
- Identify your key sales metrics: Decide what you want to track with charts—such as pipeline stages, lead sources, sales by rep, or revenue forecasts. Confirm the CRM supports these metrics.
- Check chart types available: Look for bar charts, funnel charts, line graphs, and pie charts. Ensure they are customizable to fit your sales process.
- Evaluate real-time updates: Make sure charts update automatically with new data, so you always see current information without manual refresh.
- Confirm drill-down capability: Good CRM charts let you click into segments to view detailed records behind the numbers, helping you understand causes.
- Assess ease of use: Charts should be easy to interpret by all team members, with clear labels, legends, and color coding.
- Test integration with your workflow: Check if charts link directly to lead records, tasks, or communications for seamless follow-up.
- Review reporting and exporting options: Verify if you can export charts as images or PDFs for meetings or external sharing.
- Consider mobile and team accessibility: Ensure charts display well on mobile devices and are accessible to your sales team anytime.
Example (fictional figures)
A plumbing company in Austin, Texas, tracks monthly lead conversion with a funnel chart for March 2026.
- Total leads in March 2026: 500 leads
- Leads qualified: 300 leads
- Proposals sent: 150 leads
- Deals won: 75 leads
Conversion rates:
- Qualified from leads = 300 ÷ 500 = 0.60 or 60%
- Proposals from qualified = 150 ÷ 300 = 0.50 or 50%
- Deals from proposals = 75 ÷ 150 = 0.50 or 50%
Overall conversion = 75 ÷ 500 = 0.15 or 15% This funnel chart helps the owner see where leads drop off and focus on improving proposal acceptance.
Common mistakes
- Choosing charts that don’t match your sales process: Prevent this by clearly defining your pipeline stages before selecting charts.
- Overloading charts with too much data: Focus charts on key metrics to avoid confusion and make insights clearer.
- Ignoring mobile or team accessibility: Make sure charts are viewable on devices your team uses and accessible remotely.
- Not verifying data accuracy: Regularly audit data inputs to keep charts reliable and trustworthy.
- Skipping drill-down features: Pick CRM charts that let you explore underlying data for better context and decision-making.
- Failing to link charts with communication tools: Integration with WhatsApp or SMS helps prompt immediate follow-up and keeps communication history connected.
Doing this in HelloGrowthCRM
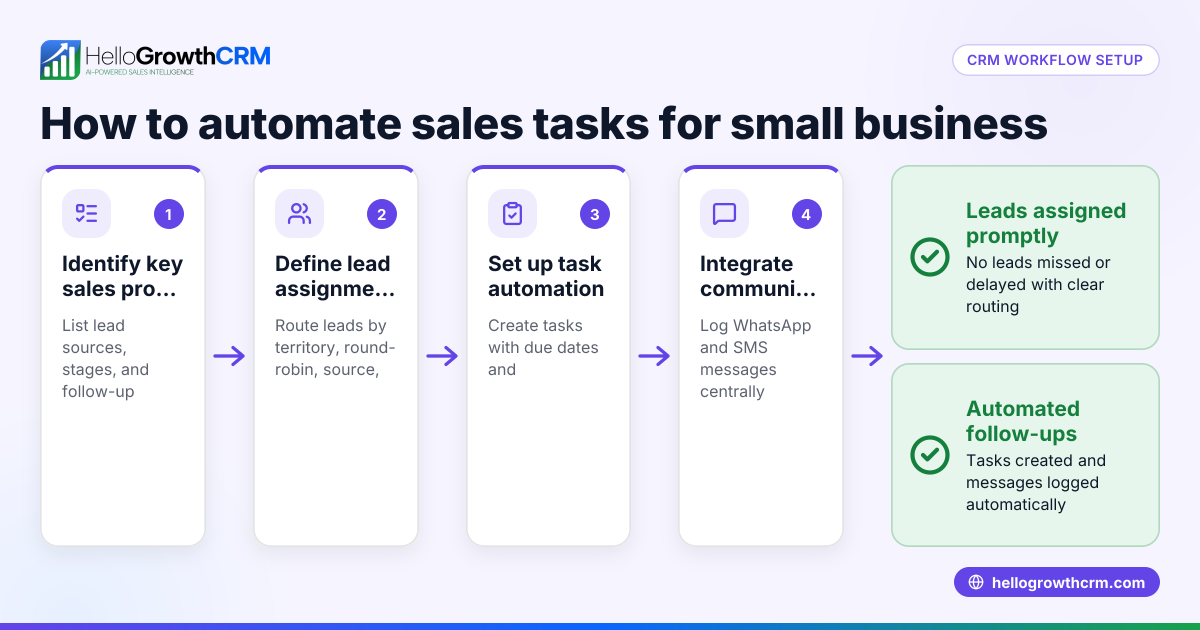
HelloGrowthCRM supports WhatsApp and SMS conversations that are logged automatically on lead records, linking communication history directly to your pipeline. Its AI agents (in Beta) draft follow-up messages after calls, so sales reps only need to review and send, speeding up response times and ensuring timely follow-up. The Free Forever plan allows a two-person team to run a full Kanban pipeline at no cost, enabling you to start tracking leads visually before upgrading for calling or WhatsApp automation. Learn more about WhatsApp and SMS CRM (/product/whatsapp-sms-crm) and the built-in CRM dialer (/product/crm-dialer).
Frequently asked questions
What are the most useful CRM charts for small businesses? Pipeline funnel charts, sales by rep bar charts, and lead source pie charts are common. They help identify where leads drop off and which sources or reps perform best.
Can CRM charts update automatically with new data? Yes, most CRM software updates charts in real time or near real time to reflect the latest pipeline and communication activity, so you always see current data.
How do CRM charts help improve sales follow-up? Charts highlight stalled deals or overdue tasks, prompting timely follow-up. Integration with messaging like WhatsApp can automate reminders and outreach, making follow-up faster and more consistent.
Are CRM charts customizable? Many CRMs let you customize chart types, date ranges, and filters to match your sales process and reporting needs, so you get relevant insights.
Can I export CRM charts for reports? Yes, exporting charts as images or PDFs is common for sharing in team meetings or with external stakeholders.
Does HelloGrowthCRM support CRM charts with communication logs? Yes, WhatsApp conversations with leads are logged on lead records, linking communication to pipeline stages for clearer context and better follow-up.
Key takeaways
- CRM charts visualize sales data to help small businesses track leads and team performance clearly.
- Choose charts that match your sales pipeline and update automatically with real-time data.
- Drill-down and integration with communication tools like WhatsApp improve follow-up and data accuracy.
- Avoid clutter by focusing charts on key metrics and ensure they are easy for your team to read and use.
- HelloGrowthCRM offers WhatsApp and SMS integration, AI agents in Beta, and a Free Forever plan to help small teams start managing pipelines visually.
- Test chart features for customization, real-time updates, drill-down, and export options before choosing a CRM.
Start managing your sales pipeline visually and efficiently with HelloGrowthCRM. Start on the Free Forever plan (200 leads, no credit card) today.
Ready to put this into practice?
Set up your pipeline, WhatsApp follow-ups, and AI lead scoring in minutes — free, no credit card.
Try HelloGrowthCRM freeGet CRM tips in your inbox
Join thousands of sales professionals who get weekly insights on CRM strategy, AI automation, and pipeline optimization.

The HelloGrowthCRM team publishes guides on CRM strategy, AI sales tools, and revenue operations for small business sales teams.