HelloGrowthCRM software
Built for real small-business sales teams
HelloGrowthCRM helps reps qualify faster, follow up on time, and close more deals—with practical automation in one place.
- AI lead scoring and pipeline visibility
- Built-in dialer, WhatsApp, and email automation
- Sales forecasting and RevOps-ready reporting
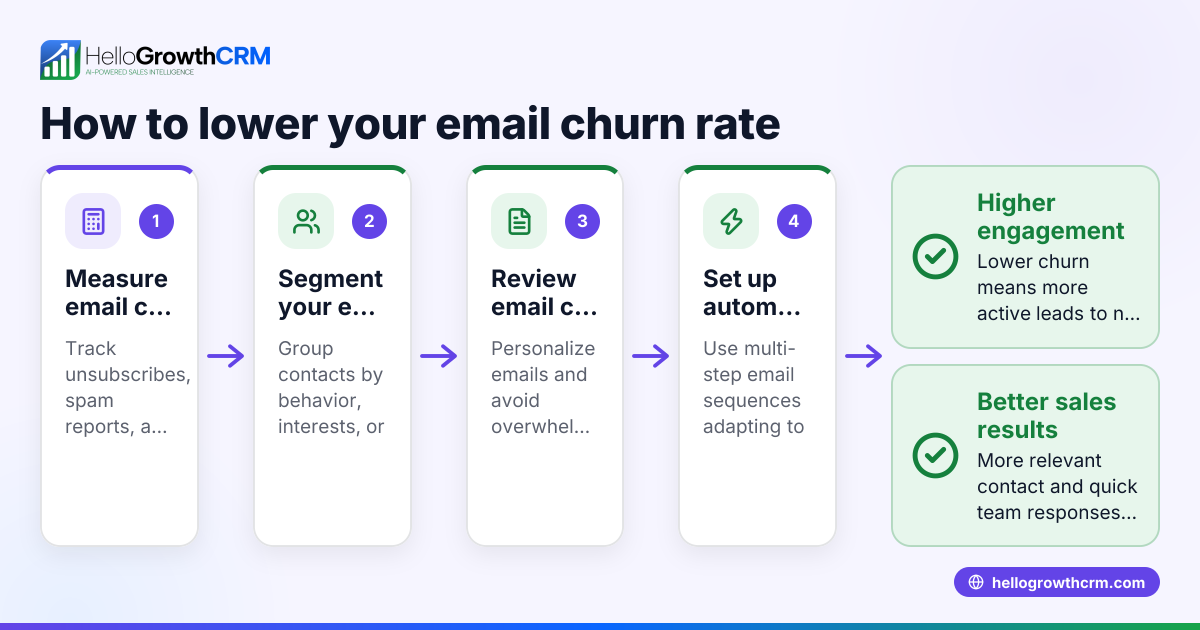
Customer churn statistics measure the percentage of customers who stop buying or using your product or service during a specific time frame. For small businesses in the US, understanding these statistics is essential because losing customers directly impacts revenue and growth. This article covers why churn happens, how to calculate your churn rate, a practical example, common errors to avoid, and how to track customer interactions efficiently using HelloGrowthCRM.
Why this comes up / what goes wrong
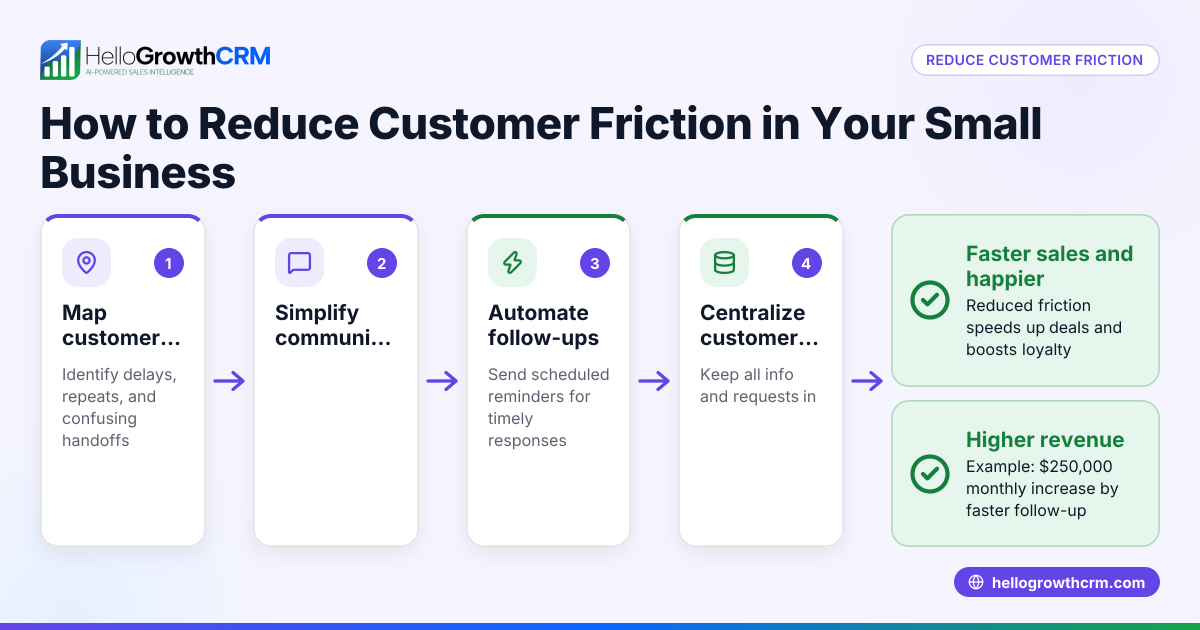
Small business owners often face the challenge of losing customers without clear insight into why it happens or how much it costs. Churn can be caused by poor follow-up, slow customer service, or lack of engagement after the sale. Without tracking churn statistics, businesses risk unseen revenue loss, inefficient sales efforts, and missed opportunities to improve customer loyalty. Many small teams rely on text messages, emails, and spreadsheets, which can lead to lost or delayed communication that increases churn.
Step-by-step
- Define the time period for measurement. Choose a consistent timeframe such as monthly or quarterly to track churn.
- Count the number of customers at the start of the period. This is your beginning customer base.
- Count the number of customers lost during the period. Include those who canceled, did not renew, or stopped purchasing.
- Calculate churn rate using the formula:
\( \text{Churn Rate} = \frac{\text{Customers Lost}}{\text{Customers at Start}} \times 100\% \)
- Analyze churn by customer segments or product lines. This helps identify specific issues.
- Compare churn rates over multiple periods. Look for trends or spikes to address.
- Check customer feedback and support tickets. This provides qualitative insight into reasons for churn.
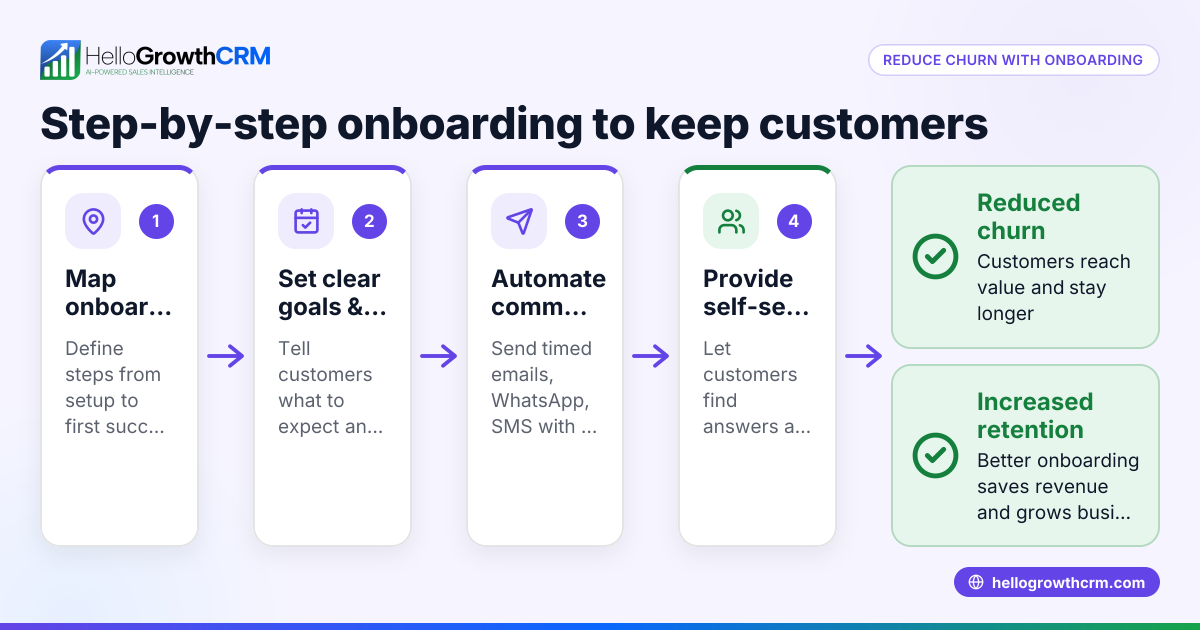
- Implement retention efforts based on findings. Examples include follow-up sequences, referral programs, or improved service.
Tracking churn alongside a customer health score can give a fuller picture of customer engagement and risk.
Example (fictional figures)
A B2B software reseller in Denver, Colorado, wants to calculate their quarterly churn rate for Q1 2026.
- Customers at 01/01/2026: 500
- Customers lost by 03/31/2026: 40
Calculation:
\( \text{Churn Rate} = \frac{40}{500} \times 100\% = 8\% \)
This means 8% of their customers stopped buying within the quarter. The business can use this figure to benchmark against industry averages or past quarters and decide if intervention is needed.
Common mistakes
- Ignoring the time period consistency. Changing the measurement period makes churn rates incomparable. Always use the same timeframe.
- Counting new customers in the denominator. The churn rate denominator should be customers at the start, not including new customers added during the period.
- Overlooking partial churn. Customers reducing purchase volume but not fully leaving might still impact revenue; track separately if possible.
- Failing to analyze churn causes. Numbers alone don’t tell you why customers leave. Use support tickets and feedback to dig deeper.
- Not integrating churn tracking with sales and service tools. Manual tracking in spreadsheets can lead to errors and delays. Linking churn data with CRM improves accuracy and follow-up.
- Neglecting customer retention strategies. Measuring churn without acting on it misses the point. Use referral programs and customer portals to engage existing customers.
Learn more about managing customer interactions with a WhatsApp and SMS CRM for faster follow-up.
Doing this in HelloGrowthCRM
HelloGrowthCRM helps small businesses track customer service requests and referrals directly linked to each customer record. After the sale, service requests stay on the same customer record as the deal, making it easier to monitor ongoing customer satisfaction and spot potential churn risks early. The branded self-service customer portal allows customers to submit tickets and access a knowledge base, improving support efficiency and retention. Tracking referrals helps identify satisfied customers who can help reduce churn by bringing in new business.
Frequently asked questions
What is a good customer churn rate for small businesses? A good churn rate varies by industry, but generally, lower is better. Many small businesses aim for less than 5-7% monthly churn. Compare your rate to industry benchmarks and track improvements over time.
How often should I calculate customer churn? Monthly or quarterly calculations are common. Monthly churn gives more immediate insight, while quarterly smooths out fluctuations. Choose a frequency that fits your sales cycle and review it regularly.
Can customer churn be predicted? Yes, using data like purchase history, engagement levels, and support tickets, predictive models or a customer health score can estimate which customers are at risk of churning.
How does customer churn affect revenue forecasting? High churn reduces predictable revenue streams and makes forecasting less accurate. Tracking churn helps adjust sales targets and budget plans accordingly.
How can I reduce customer churn effectively? Focus on fast follow-up, personalized communication, excellent customer service, and engaging referral programs. Tools like HelloGrowthCRM’s customer portal and ticket system support these efforts.
Key takeaways
- Customer churn statistics measure the percentage of customers lost in a set period.
- Calculate churn by dividing customers lost by customers at the start of the period.
- Consistent measurement and cause analysis are essential to understand churn.
- Common mistakes include inconsistent periods, wrong denominators, and ignoring churn causes.
- HelloGrowthCRM helps track service requests and referrals on the same customer record to reduce churn risk.
Start tracking your customer churn and improve retention today. Start on the Free Forever plan (200 leads, no credit card).
Ready to put this into practice?
Set up your pipeline, WhatsApp follow-ups, and AI lead scoring in minutes — free, no credit card.
Try HelloGrowthCRM freeGet CRM tips in your inbox
Join thousands of sales professionals who get weekly insights on CRM strategy, AI automation, and pipeline optimization.

The HelloGrowthCRM team publishes guides on CRM strategy, AI sales tools, and revenue operations for small business sales teams.