HelloGrowthCRM software
Built for real small-business sales teams
HelloGrowthCRM helps reps qualify faster, follow up on time, and close more deals—with practical automation in one place.
- AI lead scoring and pipeline visibility
- Built-in dialer, WhatsApp, and email automation
- Sales forecasting and RevOps-ready reporting
A monthly sales dashboard template is a practical tool that helps UAE small businesses monitor their sales progress, revenue trends, and pipeline health every month. It organises key sales data into a clear format, enabling you to spot growth opportunities and challenges quickly. This article covers why small businesses need a dashboard, how to set one up step-by-step, a worked example with UAE figures, common mistakes to watch for, and how free sales tools and pipeline features support sales tracking.
Why this comes up / what goes wrong
Small business owners in the UAE often lose track of monthly sales performance because they rely on WhatsApp, calls, or spreadsheets that aren’t designed for sales reporting. Without a ready-to-use monthly sales dashboard template, it’s hard to see which deals are progressing or stalled, how much revenue to expect, or if targets are being met. This leads to slow follow-up, missed targets, and lost leads. A practical template helps organise data consistently and avoid these problems.
Step-by-step
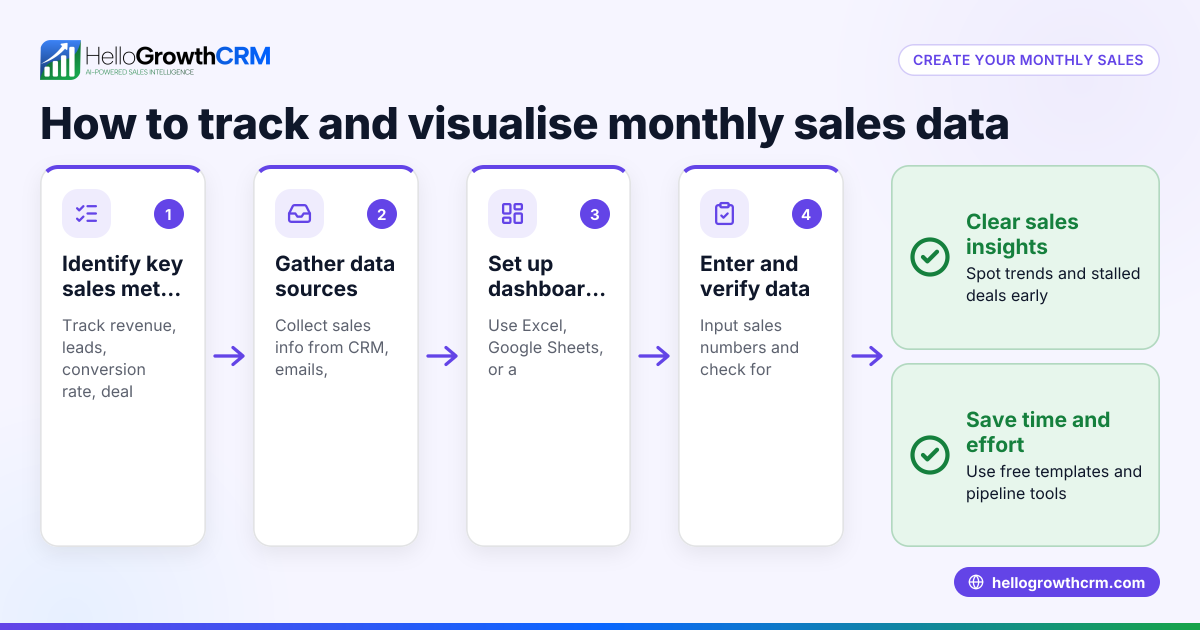
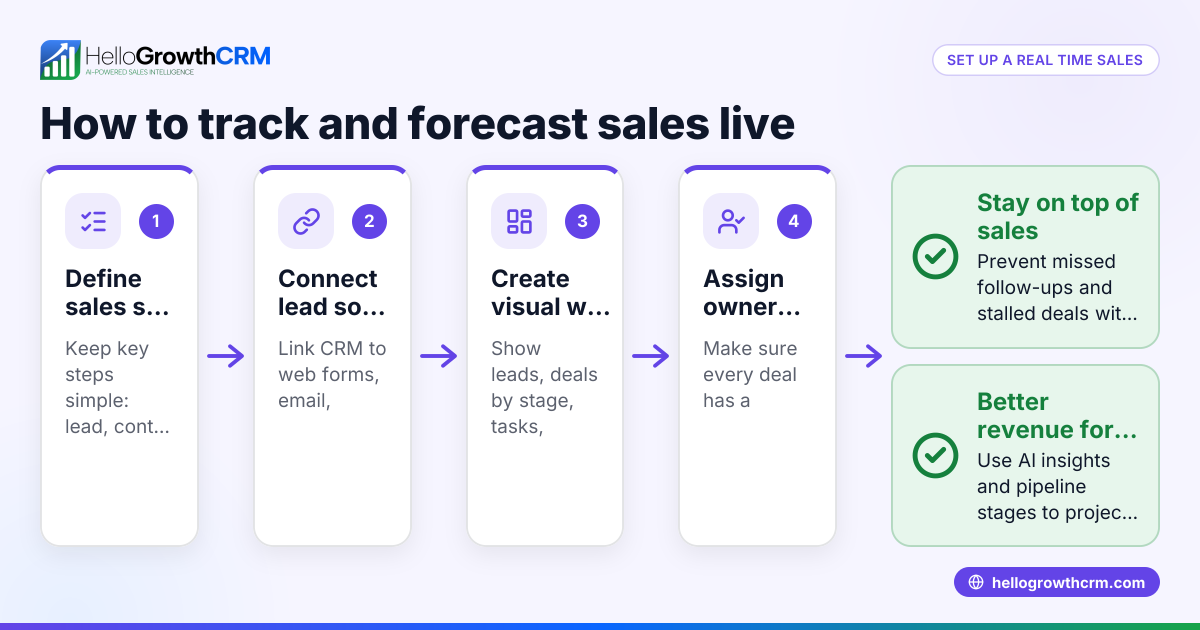
- Define key sales metrics to track: Include total sales revenue, number of deals won, deals lost, average deal size, and pipeline value by stage. Check that these metrics reflect your sales process.
- Set up data sources: Collect sales data from your CRM, calls, WhatsApp conversations, or spreadsheets. Verify data accuracy and completeness.
- Create the dashboard layout: Use Excel, Google Sheets, or a dashboard tool. Arrange sections for monthly revenue, pipeline stages, win rates, and follow-up tasks. Check for clarity and easy navigation.
- Input monthly sales data: Enter actual sales figures and update pipeline stages regularly. Confirm all data matches source records.
- Visualise with charts: Add bar charts for revenue trends, pie charts for pipeline distribution, and line graphs for win rates over months. Ensure charts update automatically when data changes.
- Set targets and compare: Include monthly sales targets and show actual vs target. Check that targets are realistic and clearly visible.
- Review and adjust monthly: At month-end, analyse the dashboard to identify stalled deals or underperforming sales reps. Adjust sales strategies accordingly.
For ready-to-use formats, you can download free sales templates and calculators from the free sales tools and calculators and sales templates pages.
Example (fictional figures)
A real-estate brokerage in Dubai Marina tracks its April 2024 sales performance:
- Total sales revenue target: AED 1,000,000
- Deals closed: 5
- Total sales revenue achieved: AED 750,000
- Pipeline value: AED 1,200,000
Calculations:
Average deal size = Total revenue / Deals closed = AED 750,000 / 5 = AED 150,000
Pipeline coverage ratio = Pipeline value / Target revenue = AED 1,200,000 / AED 1,000,000 = 1.2
This indicates the brokerage has a pipeline value 1.2 times its monthly target, showing sufficient potential deals in progress.
Common mistakes
- Using inconsistent data sources: Mixing WhatsApp messages, calls, and spreadsheets without centralising data causes errors. Prevent by consolidating sales data in one place.
- Ignoring pipeline stages: Not tracking deals by stage leads to missed follow-ups. Use a pipeline template to visualise deal progress.
- Overcomplicating the dashboard: Too many metrics or complex charts confuse users. Keep it simple and focused on key sales indicators.
- Not updating data regularly: Outdated dashboards give wrong insights. Schedule weekly updates to keep data fresh.
- Setting unrealistic targets: Targets too high or low demotivate teams. Base targets on historical sales and market conditions.
- Failing to review dashboard insights: Collecting data without action wastes effort. Use monthly reviews to adjust sales tactics.
Download practical templates and avoid these mistakes with free sales tools and calculators available at free sales tools and calculators.
Doing this in HelloGrowthCRM
Free sales tools, templates and calculators can be downloaded without an account, including follow-up cadence and pipeline templates. The deals (pipeline) feature tracks open opportunities from first contact through to closing, with stage movement, probability, and expected value, ensuring quotations sent last week show up at the 'quote sent' stage with follow-up dates so no deal is forgotten. Pipeline forecast and AI tools highlight where deals stall and project expected revenue without building spreadsheets. Learn more about these features for UAE businesses here.
Frequently asked questions
What should a monthly sales dashboard include for a UAE small business? A monthly sales dashboard should include total sales revenue, number of deals won and lost, average deal size, pipeline value by stage, and comparison against monthly targets. These metrics help you track sales performance clearly.
Can I use Excel to create a monthly sales dashboard? Yes, Excel or Google Sheets are common tools for creating sales dashboards. Use tables for data input and charts for visualisation. Ensure you update data regularly and keep the layout simple.
How often should I update my sales dashboard? Ideally, update your sales dashboard weekly or at least monthly. Regular updates help you spot stalled deals early and adjust your sales approach in time.
Are there free sales dashboard templates available for UAE businesses? Yes, free sales templates and calculators are available for download without sign-up, including pipeline and follow-up templates tailored for sales teams.
How does a CRM help with monthly sales dashboards? A CRM centralises sales data, tracks deal stages, and automates follow-ups. It reduces manual errors and provides real-time insights into your sales pipeline and performance.
Key takeaways
- Use a monthly sales dashboard template to track revenue, deals, and pipeline stages clearly.
- Consolidate sales data from all sources into one dashboard for accuracy.
- Update your dashboard regularly and keep it simple with key metrics.
- Avoid common mistakes like inconsistent data, ignoring pipeline stages, and unrealistic targets.
- Download free sales templates and calculators to get started quickly.
- Use pipeline and AI insights to manage your sales process efficiently.
Start tracking your sales more effectively today. Start on the Free Forever plan (200 leads, no credit card).
Ready to put this into practice?
Set up your pipeline, WhatsApp follow-ups, and AI lead scoring in minutes — free, no credit card.
Try HelloGrowthCRM freeGet CRM tips in your inbox
Join thousands of sales professionals who get weekly insights on CRM strategy, AI automation, and pipeline optimization.

The HelloGrowthCRM team publishes guides on CRM strategy, AI sales tools, and revenue operations for small business sales teams.