HelloGrowthCRM software
Built for real small-business sales teams
HelloGrowthCRM helps reps qualify faster, follow up on time, and close more deals—with practical automation in one place.
- AI lead scoring and pipeline visibility
- Built-in dialer, WhatsApp, and email automation
- Sales forecasting and RevOps-ready reporting
Data visualization dashboards turn complex business data into clear visuals such as charts, graphs, and boards. Examples include sales pipelines that track deal stages, lead source breakdowns showing conversion rates, and revenue forecasts projecting expected income. These dashboards help small businesses understand performance at a glance and act on insights to improve sales and lead follow-up.
Why this comes up / what goes wrong
Small-business owners often face scattered data across spreadsheets, text messages, emails, and manual notes. Without a clear dashboard, it’s difficult to see where deals are stalling or which marketing channels generate the best leads. This lack of visibility causes slow follow-up, lost sales, and wasted time updating multiple tools. Many owners rely on manual tracking, which is time-consuming and error-prone, making it hard to prioritize leads or forecast revenue accurately.
Step-by-step
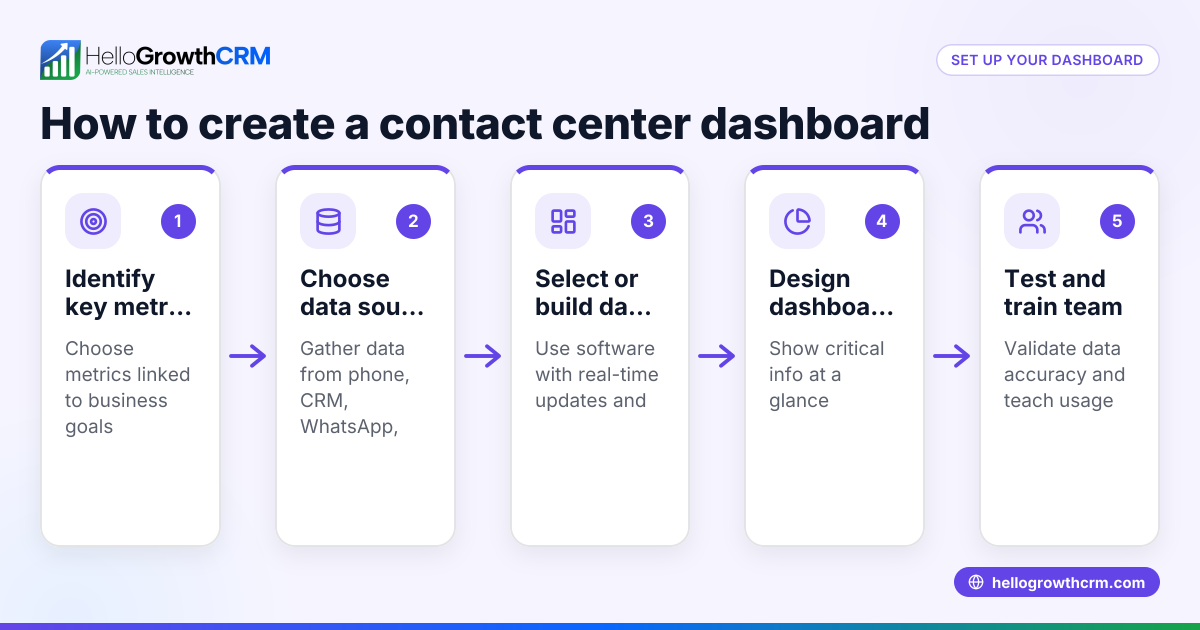
- Identify key metrics: Choose what to track, such as number of leads, deal stages, sales forecast, and follow-up tasks. Focus on metrics that directly impact your sales process.
- Gather data sources: Collect information from your CRM, web forms, emails, call logs, and other tools where leads and deals are recorded.
- Pick visualization types: Use funnel charts for sales stages, bar charts for lead sources, line graphs for revenue trends, and task boards for managing follow-ups. Visual variety helps communicate different data clearly.
- Build the dashboard: Combine these visual elements on one screen for a quick overview. Ensure it updates automatically or can be refreshed easily.
- Review regularly: Check the dashboard daily or weekly to spot stalled deals or performance drops. Use this insight to prioritize sales activities.
- Adjust as needed: Add or remove metrics based on what helps decision-making. Keep the dashboard focused and actionable.
Example (fictional figures)
A residential real-estate team in Phoenix, Arizona tracks their sales pipeline and revenue forecast for Q2 2026.
- Leads captured in April: 120
- Leads converted to deals: 30
- Average deal size: $250,000
- Deals in negotiation stage: 10
- Deals in closing stage: 5
Calculate expected revenue from deals in negotiation and closing stages:
Negotiation stage expected revenue: 10 deals × $250,000 = $2,500,000
Closing stage expected revenue: 5 deals × $250,000 = $1,250,000
Total expected revenue: $2,500,000 + $1,250,000 = $3,750,000
This dashboard shows the team where deals are concentrated and the forecasted revenue, helping prioritize efforts to close deals before the quarter ends.
Common mistakes
- Overloading the dashboard: Including too many metrics creates confusion. Focus on key sales and lead indicators to keep the dashboard simple and actionable.
- Ignoring data quality: Using incorrect or outdated data leads to wrong decisions. Regularly verify data accuracy and update sources.
- Not updating frequently: Dashboards must reflect current status to be useful. Set a routine for daily or weekly updates.
- Skipping action plans: Visuals alone don’t improve sales; plan follow-up actions based on dashboard insights.
- Not using integrated tools: Manually combining data wastes time and risks errors. Use CRM features like pipeline forecast and AI insights to automate this step (see pipeline forecast and AI insights).
- Neglecting data protection: Make sure customer data is stored securely, especially if your team requires data residency. This protects your business and customer trust.
Doing this in HelloGrowthCRM
HelloGrowthCRM offers pipeline forecast and AI insights that automatically analyze your sales stages and predict revenue without building spreadsheets. This helps you see which deals are stalling and which reps are performing well. It also ensures customer data security with SOC 2 Type II compliance and data residency options for teams that need it (security and compliance). These features streamline dashboard creation and keep your data safe.
Frequently asked questions
What types of dashboards are best for small businesses? Sales pipelines, lead source tracking, and revenue forecasts are most useful. They provide clear views of progress and bottlenecks.
How often should I update my dashboard? Daily or weekly updates keep the data relevant and help you act quickly on stalled deals or new leads.
Can I create dashboards without technical skills? Yes, many CRM tools like HelloGrowthCRM offer built-in dashboards and AI insights that require no coding (HelloGrowthCRM for the United States).
What is the difference between a dashboard and a report? Dashboards provide real-time, visual summaries on one screen. Reports are detailed documents often used for deeper analysis.
How can I track sales performance on mobile? Use CRM tools with mobile-friendly dashboards and built-in dialers to manage calls and messages on the go (built-in CRM dialer).
Why is data protection important in dashboards? Customer data must be protected to comply with regulations and build trust. HelloGrowthCRM provides SOC 2 Type II compliance and data residency options to meet these needs.
Key takeaways
- Focus dashboards on key sales and lead metrics relevant to your business.
- Use visual tools like charts and task boards to track pipeline stages and revenue forecasts.
- Regularly update and verify data to keep dashboards accurate.
- Avoid clutter and plan follow-up actions based on dashboard insights.
- Leverage CRM features like AI insights and pipeline forecasting to automate dashboard updates and analysis.
- Ensure your dashboard data is secure and compliant with regulations.
Start building your data visualization dashboard today to improve lead follow-up and sales tracking. You can try HelloGrowthCRM’s Free Forever plan with 200 leads and no credit card at Start on the Free Forever plan (200 leads, no credit card).
Ready to put this into practice?
Set up your pipeline, WhatsApp follow-ups, and AI lead scoring in minutes — free, no credit card.
Try HelloGrowthCRM freeGet CRM tips in your inbox
Join thousands of sales professionals who get weekly insights on CRM strategy, AI automation, and pipeline optimization.

The HelloGrowthCRM team publishes guides on CRM strategy, AI sales tools, and revenue operations for small business sales teams.