HelloGrowthCRM software
Built for real small-business sales teams
HelloGrowthCRM helps reps qualify faster, follow up on time, and close more deals—with practical automation in one place.
- AI lead scoring and pipeline visibility
- Built-in dialer, WhatsApp, and email automation
- Sales forecasting and RevOps-ready reporting
A sales dashboard helps you track your business’s sales performance clearly and quickly. For Singapore small businesses, building one means selecting the right sales metrics, collecting data consistently, and displaying it in a way that supports daily decisions. This guide explains why you need a sales dashboard, how to build one step-by-step, a detailed example with Singapore dollar figures, common mistakes to avoid, and how HelloGrowthCRM’s sales tools can assist.
Why this comes up / what goes wrong
Many Singapore small-business owners lose sales due to slow or scattered follow-up, or because their sales data is spread across WhatsApp, email, and spreadsheets. Without a clear dashboard, it’s hard to know which deals are stalling, what the sales forecast looks like, or where to focus the team’s efforts. Building a sales dashboard addresses these problems by consolidating data into a single view that highlights pipeline status, revenue projections, and sales activities.
Step-by-step
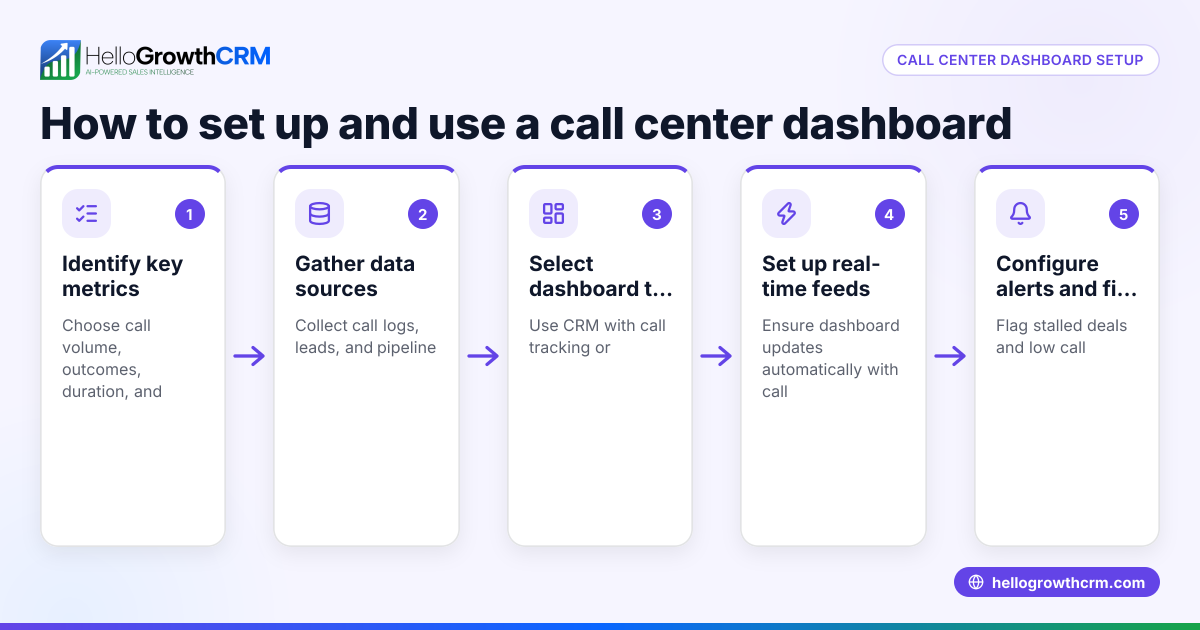
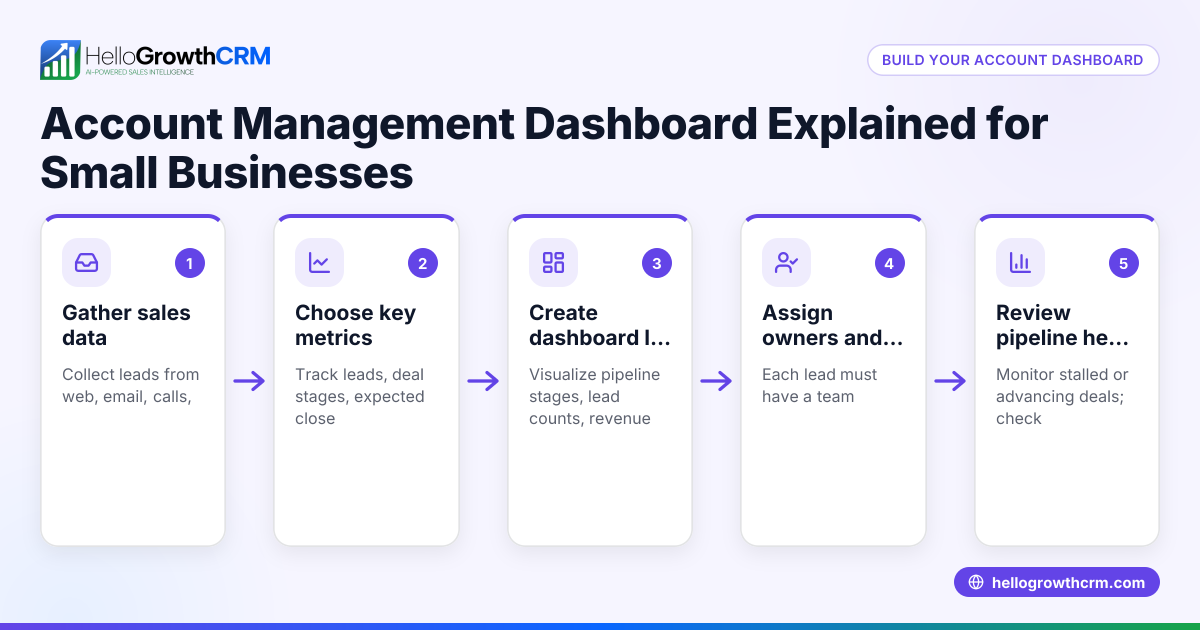
- Identify key sales metrics to track: Choose metrics relevant to your business such as total sales revenue, number of deals in each pipeline stage, average deal size, sales cycle length, and follow-up tasks pending.
- Collect accurate sales data: Gather data from your sales channels like WhatsApp conversations, emails, and quotations sent. Ensure the data is updated regularly and correctly.
- Select your dashboard platform or tool: Use spreadsheet software like Excel or Google Sheets, or a CRM system with dashboard features. Ensure it supports integration or manual input of your sales data.
- Design the dashboard layout: Arrange your metrics to prioritise the most important insights—pipeline stages, deal values, and follow-up dates should be prominent.
- Create visual elements: Use charts, tables, and colour-coded indicators to show progress and bottlenecks clearly.
- Set up regular updates and reviews: Schedule daily or weekly updates and review sessions to keep the dashboard current and actionable.
- Train your team: Make sure your sales team understands how to use the dashboard and input data correctly.
Example (fictional figures)
A property agency in Novena wants to track its sales pipeline for Q2 2024.
- Total deals in pipeline: 20
- Deals by stage:
- Prospecting: 5 deals, average expected value S$80,000
- Quote sent: 8 deals, average expected value S$120,000
- Negotiation: 4 deals, average expected value S$150,000
- Closing: 3 deals, average expected value S$200,000
Calculate total expected sales value:
Prospecting stage: 5 × S$80,000 = S$400,000 Quote sent stage: 8 × S$120,000 = S$960,000 Negotiation stage: 4 × S$150,000 = S$600,000 Closing stage: 3 × S$200,000 = S$600,000
Total expected sales = S$400,000 + S$960,000 + S$600,000 + S$600,000 = S$2,560,000
This dashboard highlights that the bulk of value is in the 'quote sent' stage, so follow-up here is critical to close deals.
Common mistakes
- Ignoring data accuracy: Prevent by regularly verifying data inputs and cleaning outdated or duplicate entries.
- Overloading the dashboard with metrics: Focus on key sales indicators to avoid clutter and confusion.
- Not updating the dashboard regularly: Schedule fixed update times to keep information fresh.
- Lack of team training: Ensure all sales staff know how to input data and interpret the dashboard correctly.
- Using disconnected tools: Avoid manual data transfers between WhatsApp, email, and spreadsheets by using integrated solutions.
Doing this in HelloGrowthCRM
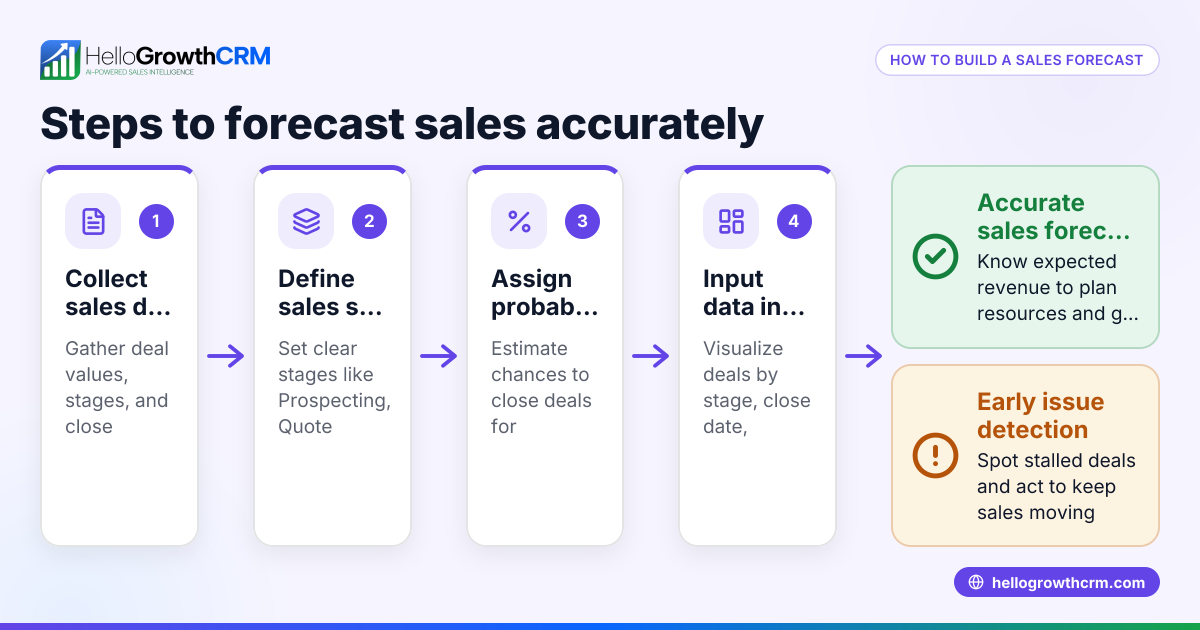
HelloGrowthCRM supports building a sales dashboard with features like Deals (pipeline), which tracks open opportunities from first contact through close with stage movement and follow-up dates, ensuring no quotation is forgotten. The Pipeline forecast and AI insights feature uses AI to project expected close amounts based on current pipeline stages and historical patterns, showing where deals stall without manual spreadsheets. For businesses with field teams, Territories, field operations and commissions allow logging visits and monitoring sales beats in real-time from mobile devices.
Frequently asked questions
What key metrics should I include in my sales dashboard? Include total sales revenue, number of deals by pipeline stage, average deal size, sales cycle length, and pending follow-ups. These metrics give a balanced view of current performance and future opportunities.
How often should I update my sales dashboard? Update your dashboard daily or at least weekly to maintain accurate and actionable insights. Frequent updates help spot stalled deals and adjust strategies promptly.
Can I build a sales dashboard without technical skills? Yes. Start with spreadsheet tools like Excel or Google Sheets using templates for sales tracking. For easier management, consider CRM tools that automate data capture and dashboard updates.
How does HelloGrowthCRM help with sales dashboards? HelloGrowthCRM provides pipeline tracking, AI forecasting, and field sales monitoring, helping you see deal stages and sales forecasts without building manual spreadsheets. It integrates communication and task management to keep your sales team aligned.
Is a sales dashboard useful for small teams? Absolutely. Even small sales teams benefit from a clear view of their pipeline and follow-ups to prioritise efforts and increase closing rates.
Key takeaways
- Define and focus on key sales metrics relevant to your business.
- Collect accurate and up-to-date sales data consistently.
- Use tools or CRM systems that support data integration and visualisation.
- Keep your dashboard simple, updated regularly, and train your team.
- Avoid common pitfalls like data errors and disconnected tools.
- HelloGrowthCRM offers pipeline management, AI forecasting, and field operations tracking to simplify dashboard building.
Start building your sales dashboard today to improve sales visibility and close more deals. To try a CRM that helps track deals, forecast sales, and manage field teams, start on the Free Forever plan (200 leads, no credit card).
Ready to put this into practice?
Set up your pipeline, WhatsApp follow-ups, and AI lead scoring in minutes — free, no credit card.
Try HelloGrowthCRM freeGet CRM tips in your inbox
Join thousands of sales professionals who get weekly insights on CRM strategy, AI automation, and pipeline optimization.

The HelloGrowthCRM team publishes guides on CRM strategy, AI sales tools, and revenue operations for small business sales teams.