HelloGrowthCRM software
Built for real small-business sales teams
HelloGrowthCRM helps reps qualify faster, follow up on time, and close more deals—with practical automation in one place.
- AI lead scoring and pipeline visibility
- Built-in dialer, WhatsApp, and email automation
- Sales forecasting and RevOps-ready reporting
A sales funnel dashboard is a visual tool that tracks the progress of leads through each stage of your sales process, from initial contact to closing the deal. It helps small business owners see where prospects are, identify bottlenecks, and forecast revenue. This article explains why you need a sales funnel dashboard, how to set one up step-by-step, a practical example, common mistakes to avoid, and how HelloGrowthCRM supports this process.
Why this comes up / what goes wrong
Small business owners often lose track of leads because they manage sales using scattered methods like text messages, emails, or spreadsheets. Without a clear overview, it’s hard to know which deals are active, which need follow-up, or where prospects drop out. This lack of visibility causes slow follow-up, missed opportunities, and inaccurate revenue forecasts. A sales funnel dashboard consolidates all this information into one place, showing each lead’s stage and helping prioritize next steps.
Step-by-step
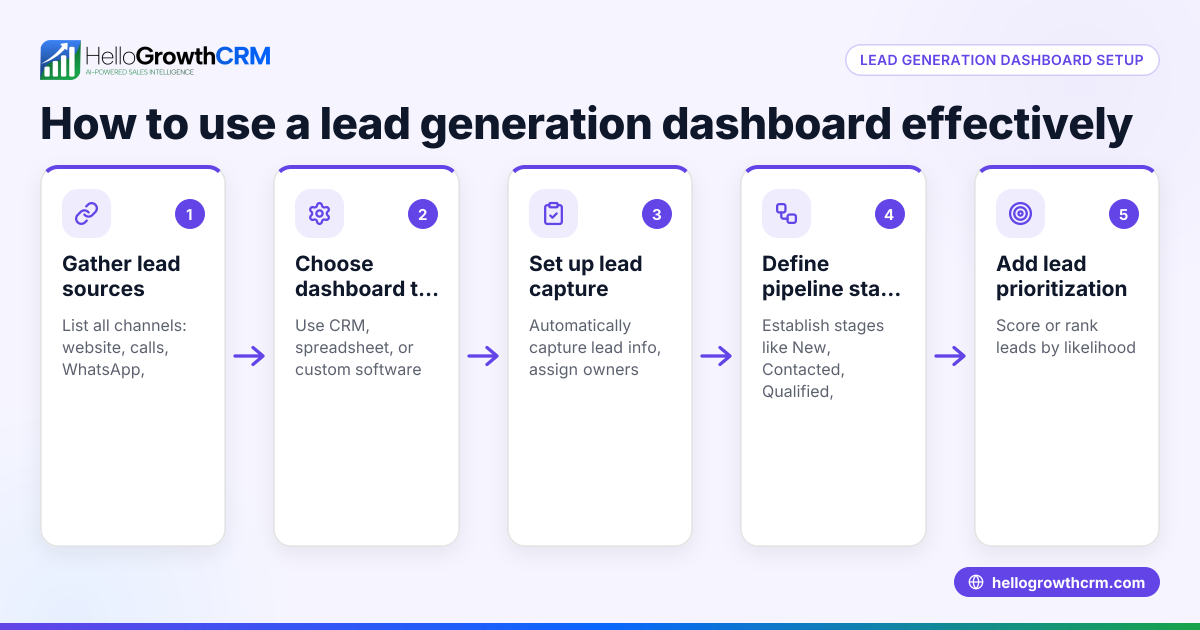
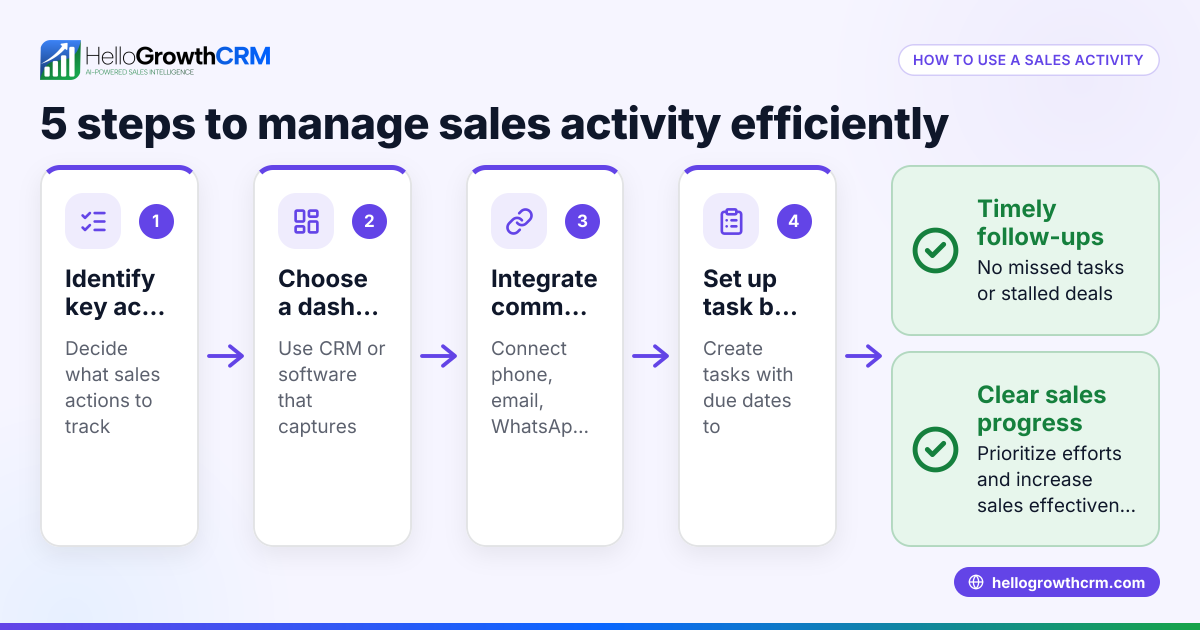
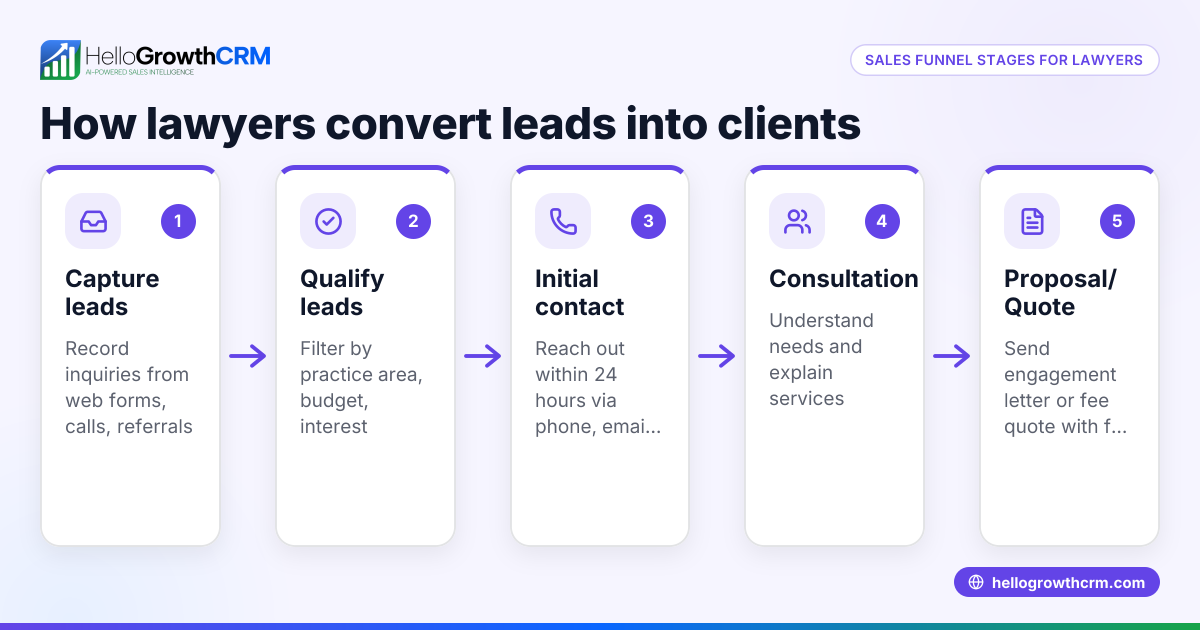
- Define your sales stages clearly. Typical stages include Lead, Contacted, Qualified, Quote Sent, Negotiation, and Closed (Won or Lost). Make sure your team agrees on the meaning of each stage.
- Collect and enter your leads into a system. Use a CRM or spreadsheet to capture lead details and assign them to the correct stage as they progress.
- Set up your dashboard to visualize the funnel. This usually means showing the number of leads and total potential revenue at each stage.
- Assign follow-up tasks and dates. For example, if a quote was sent last week, set a reminder to follow up so the deal does not get forgotten.
- Review the dashboard regularly. Check for stages where deals stall or drop off and investigate why.
- Use the dashboard to forecast revenue. Estimate expected sales based on the number of deals in each stage and their probability of closing.
- Adjust your sales process or team focus based on insights. For example, increase efforts on leads stuck in negotiation or improve qualification criteria.
- Keep the dashboard updated daily. Accurate data is essential for useful insights.
Example (fictional figures)
A two-location dental practice in Columbus, Ohio, tracks its sales funnel for new patient packages on 06/15/2026.
- Leads at Lead stage: 50
- Leads Contacted: 40
- Leads Qualified: 30
- Quotes Sent: 20
- Negotiation: 10
- Closed Won: 5
Assumed average package price: $1,200
Calculate potential revenue per stage:
Leads at Lead stage: 50 × $1,200 = $60,000 Leads Contacted: 40 × $1,200 = $48,000 Leads Qualified: 30 × $1,200 = $36,000 Quotes Sent: 20 × $1,200 = $24,000 Negotiation: 10 × $1,200 = $12,000 Closed Won: 5 × $1,200 = $6,000
If the probability to close is estimated as:
Lead stage: 10% Contacted: 25% Qualified: 50% Quote Sent: 70% Negotiation: 85%
Expected revenue:
Lead stage: $60,000 × 10% = $6,000 Contacted: $48,000 × 25% = $12,000 Qualified: $36,000 × 50% = $18,000 Quote Sent: $24,000 × 70% = $16,800 Negotiation: $12,000 × 85% = $10,200
Total forecasted revenue = $6,000 + $12,000 + $18,000 + $16,800 + $10,200 = $63,000
This shows the owner where revenue is likely coming from and which stages need attention.
Common mistakes
- Not defining sales stages clearly. Prevent by agreeing on stage definitions with your team before tracking.
- Failing to update the dashboard regularly. Prevent by assigning responsibility for daily updates.
- Ignoring stalled deals. Prevent by reviewing the dashboard weekly and setting follow-up tasks.
- Using multiple disconnected tools. Prevent by consolidating leads and pipeline data in one system.
- Not setting follow-up reminders. Prevent by adding follow-up dates to deals, so no quote or negotiation is forgotten.
- Overcomplicating the dashboard with too many metrics. Prevent by focusing on key stages and revenue forecasts.
Doing this in HelloGrowthCRM
HelloGrowthCRM helps small businesses manage their sales funnel with Deals (pipeline) — allowing you to track open opportunities from first contact through close. For example, a quotation sent last week appears as a deal at the "quote sent" stage with a follow-up date, ensuring it is not forgotten. The platform also offers Pipeline forecast and AI insights, showing which stages deals are stalling in without needing to build spreadsheets. For businesses with field sales, Territories, field operations and commissions features let reps log visits from their phones while managers see the day's activities. Learn more about WhatsApp and SMS CRM, the built-in CRM dialer, and HelloGrowthCRM for the United States.
Frequently asked questions
What is the main benefit of a sales funnel dashboard? A sales funnel dashboard gives a clear, visual overview of where leads are in your sales process. It helps prioritize follow-up, identify bottlenecks, and forecast revenue, improving sales effectiveness.
How often should I update my sales funnel dashboard? Ideally, update your dashboard daily to keep data accurate and actionable. Regular updates ensure you don’t miss follow-ups or let deals stagnate.
Can I create a sales funnel dashboard without software? Yes, you can use spreadsheets to track stages and calculate potential revenue. However, this requires manual updates and can get complex as your leads grow.
What should I do if many deals stall at one stage? Investigate why leads aren’t progressing. It might be a lack of follow-up, pricing issues, or product concerns. Adjust your sales approach or provide additional training.
How does AI help in sales funnel dashboards? AI can analyze historical data to forecast revenue and highlight deals likely to close or stall. This helps you focus on high-value opportunities without manual calculations.
Can HelloGrowthCRM handle field sales activities? Yes, it offers Territories, field operations and commissions features where field reps log visits from their phones, and managers monitor daily beats.
Key takeaways
- A sales funnel dashboard tracks leads through defined sales stages visually.
- Regular updates and follow-up reminders prevent lost or stalled deals.
- Forecasting expected revenue helps prioritize sales efforts.
- Avoid using disconnected tools; keep all data consolidated.
- HelloGrowthCRM’s Deals pipeline and AI insights simplify funnel management.
- Field sales teams benefit from mobile visit logging and territory management.
Start organizing your sales pipeline today and improve follow-up with HelloGrowthCRM. Start on the Free Forever plan (200 leads, no credit card).
Ready to put this into practice?
Set up your pipeline, WhatsApp follow-ups, and AI lead scoring in minutes — free, no credit card.
Try HelloGrowthCRM freeGet CRM tips in your inbox
Join thousands of sales professionals who get weekly insights on CRM strategy, AI automation, and pipeline optimization.

The HelloGrowthCRM team publishes guides on CRM strategy, AI sales tools, and revenue operations for small business sales teams.