HelloGrowthCRM software
Built for real small-business sales teams
HelloGrowthCRM helps reps qualify faster, follow up on time, and close more deals—with practical automation in one place.
- AI lead scoring and pipeline visibility
- Built-in dialer, WhatsApp, and email automation
- Sales forecasting and RevOps-ready reporting
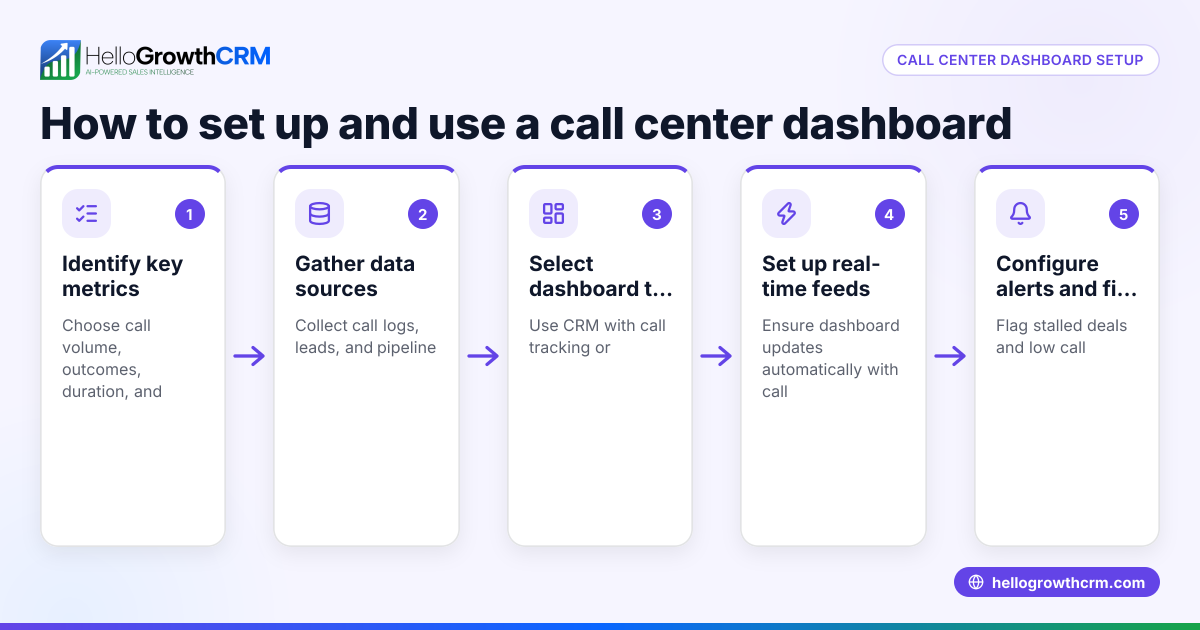
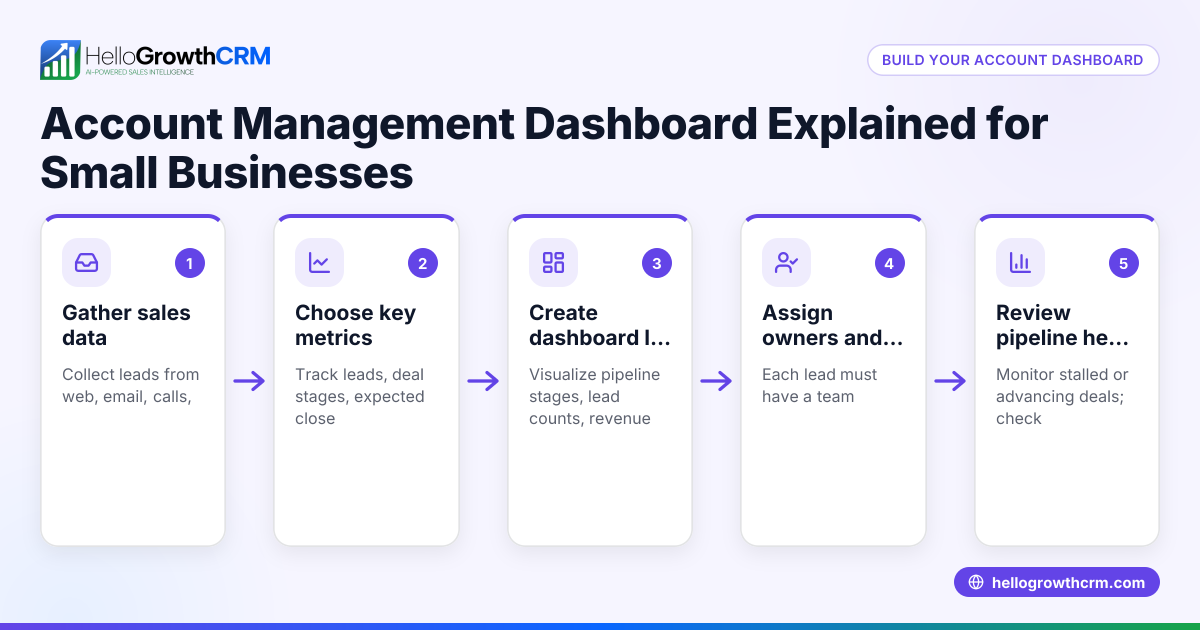
To build a customer support dashboard for your US business, begin by identifying the most important support metrics such as ticket count, average resolution time, and customer satisfaction scores. Gather data from all your support channels, then use a dashboard tool or spreadsheet to display these metrics clearly. This article covers why small businesses need a customer support dashboard, step-by-step instructions to create one, a worked example with realistic figures, common pitfalls, and how HelloGrowthCRM supports this process.
Why this comes up / what goes wrong
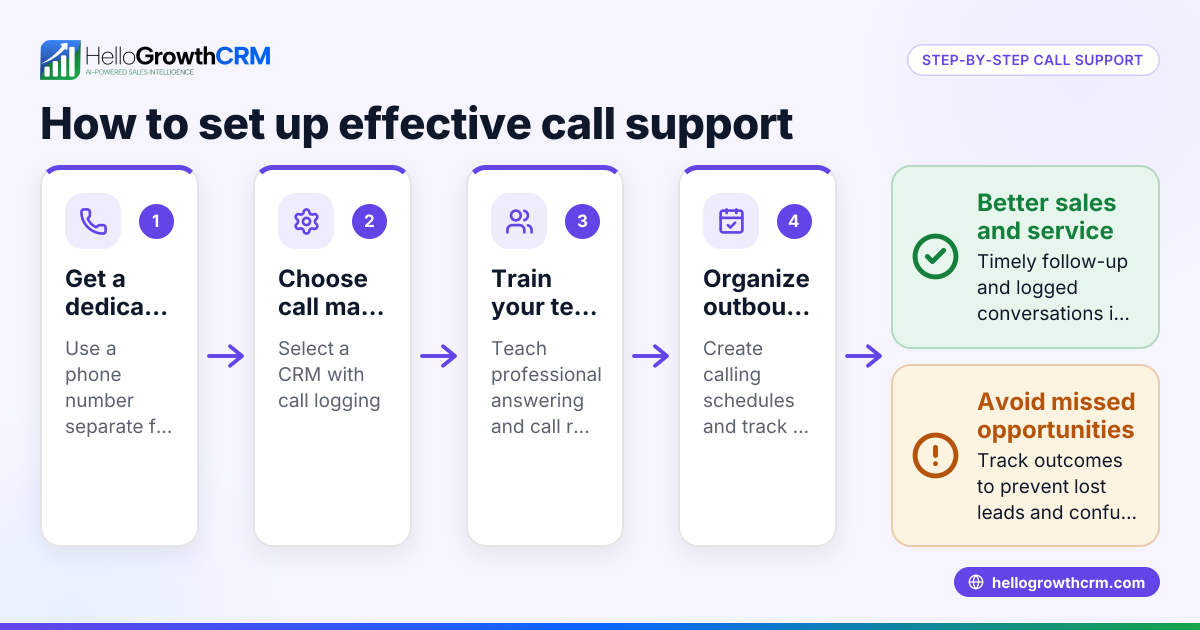
Small business owners often struggle to keep track of customer support performance because support activities happen across multiple channels like email, WhatsApp, SMS, and phone calls. Without a centralized view, it is hard to see which issues are urgent, how fast your team resolves tickets, or where customers get stuck. This leads to slow response times, lost leads, and unhappy customers. A customer support dashboard organizes this information in one place so you can monitor performance, spot bottlenecks, and improve service quality.
Step-by-step
- Define your key support metrics: Decide what to track based on your business goals. Common metrics include:
- Number of open and closed tickets
- Average response and resolution time
- Customer satisfaction ratings (CSAT)
- Ticket backlog and SLA compliance
- Identify your data sources: List all channels where support requests come from, such as email, WhatsApp, SMS, phone calls, and web forms. Make sure you can export or access data from each.
- Choose your dashboard tool: This can be a CRM with built-in reporting, a business intelligence tool, or a spreadsheet if you prefer manual setup.
- Set up data collection and integration: Connect your support channels to your dashboard tool or regularly export data to update your dashboard.
- Build the dashboard layout: Create clear sections or charts for each key metric. Use tables, bar charts, or line graphs to visualize trends.
- Add filters and drill-downs: Allow filtering by date, support agent, or ticket type to analyze specific areas.
- Test and refine: Review the dashboard with your team, ensure data accuracy, and adjust metrics or visuals as needed.
- Schedule regular reviews: Use the dashboard in daily or weekly meetings to monitor support performance and take action.
- Track customer health score: Consider integrating a customer health score to anticipate churn or upsell opportunities. See more on customer health score.
- Leverage AI insights: If available, use AI features to detect stalled tickets or forecast support workload, reducing manual tracking.
Example (fictional figures)
A B2B software reseller in Denver, Colorado, wants to build a monthly customer support dashboard for April 2024.
- Total tickets received: 1,200
- Tickets resolved: 1,050
- Average resolution time: 6 hours
- Customer satisfaction score: 88%
- SLA compliance rate: 95%
Calculations:
- Open tickets = Total tickets - Resolved tickets = 1,200 - 1,050 = 150
- Resolution rate = (Resolved tickets / Total tickets) × 100 = (1,050 / 1,200) × 100 = 87.5%
- Average resolution time is already given as 6 hours.
- SLA compliance is 95%, indicating most tickets met the promised resolution time.
This dashboard would show:
- 1,200 tickets received in April
- 150 tickets still open
- 87.5% resolution rate
- 6 hours average resolution time
- 88% customer satisfaction
- 95% SLA compliance
This clear layout helps the team focus on reducing open tickets and improving satisfaction.
Common mistakes
- Tracking too many metrics at once: Focus on a few key indicators relevant to your business goals to avoid clutter. Prevent by defining your priorities before building.
- Using inconsistent data sources: Mixing manual and automated data without validation leads to errors. Prevent by standardizing data collection and checking regularly.
- Ignoring customer feedback metrics: Only tracking tickets without satisfaction scores misses the customer experience. Always include CSAT or NPS.
- Not updating the dashboard regularly: Outdated data makes the dashboard useless. Set automated updates or assign responsibility for manual refresh.
- Overcomplicating visuals: Too many charts or complex graphs confuse users. Use simple, clear visuals and labels.
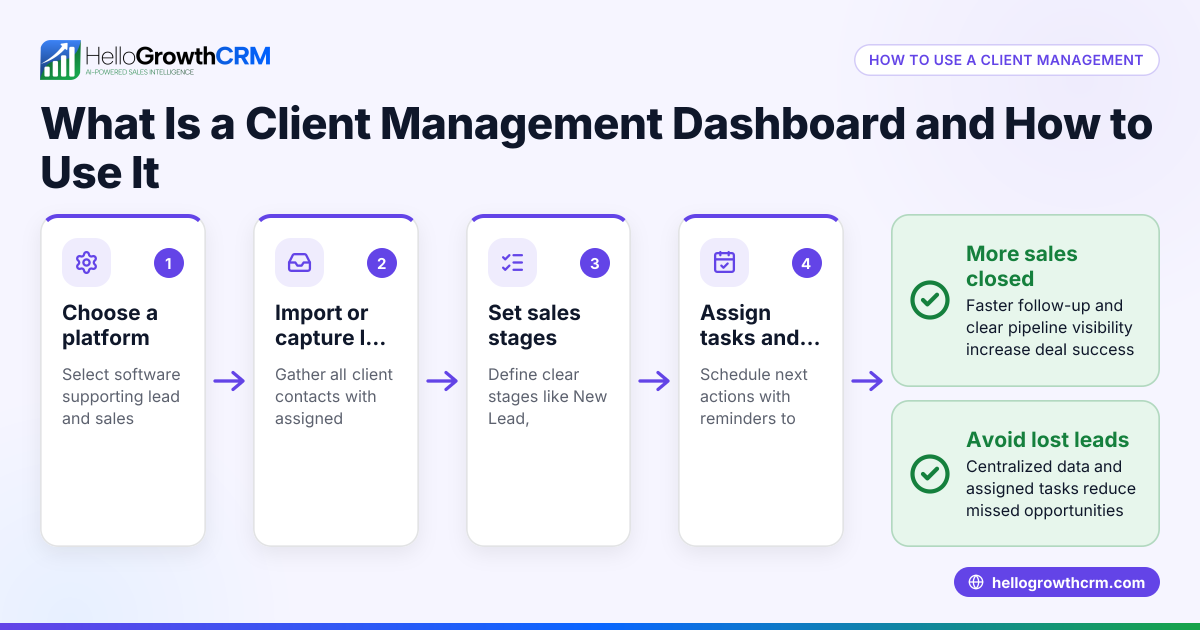
- Not linking support data to sales or customer records: This disconnects support from overall customer health. Use a CRM that keeps support tickets on the same customer record, like HelloGrowthCRM.
Doing this in HelloGrowthCRM
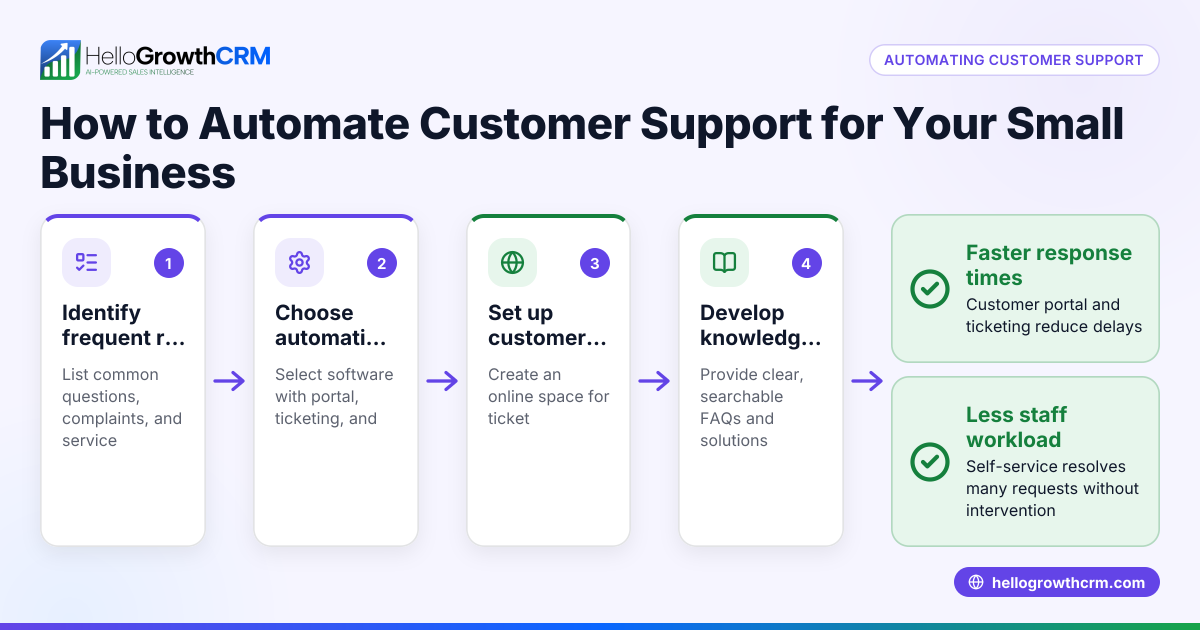
HelloGrowthCRM offers a customer portal with support tickets and a knowledge base, keeping service requests linked to the same customer record as the deal. This centralizes support data for easy tracking. Its pipeline forecast and AI insights let you see which deals or support issues are stalling without building spreadsheets. Learn more about HelloGrowthCRM for the United States at /usa and its WhatsApp and SMS CRM features at WhatsApp and SMS CRM.
Frequently asked questions
What key metrics should I include in a customer support dashboard? Include ticket volume, resolution time, customer satisfaction (CSAT), backlog, and SLA compliance. These metrics give a balanced view of support efficiency and customer experience.
Can I build a customer support dashboard without special software? Yes, you can use spreadsheets like Excel or Google Sheets to manually collect and visualize data. However, CRM tools with built-in dashboards automate data collection and provide real-time insights.
How often should I update my customer support dashboard? Update frequency depends on your support volume and needs. Daily or weekly updates are common to keep information current and actionable.
How does linking support tickets to customer records help? It provides a complete view of the customer journey, helping sales and support teams collaborate better and improve customer health. HelloGrowthCRM supports this by keeping service requests on the same record as deals.
What role do AI insights play in customer support dashboards? AI can forecast workload, identify stalled tickets, and highlight performance trends, reducing manual effort and helping prioritize actions. HelloGrowthCRM offers these AI insights in its pipeline forecasting.
Key takeaways
- Define clear, relevant support metrics before building your dashboard.
- Collect data consistently from all support channels.
- Use simple, visual layouts with filters for detailed analysis.
- Regularly update and review your dashboard to improve support.
- Avoid common mistakes like tracking too many metrics or inconsistent data.
- HelloGrowthCRM integrates support tickets with customer records and offers AI insights for better management.
Start building your customer support dashboard today to improve your team's responsiveness and customer satisfaction.
Start on the Free Forever plan (200 leads, no credit card) at free CRM for small business.
Ready to put this into practice?
Set up your pipeline, WhatsApp follow-ups, and AI lead scoring in minutes — free, no credit card.
Try HelloGrowthCRM freeGet CRM tips in your inbox
Join thousands of sales professionals who get weekly insights on CRM strategy, AI automation, and pipeline optimization.

The HelloGrowthCRM team publishes guides on CRM strategy, AI sales tools, and revenue operations for small business sales teams.