HelloGrowthCRM software
Built for real small-business sales teams
HelloGrowthCRM helps reps qualify faster, follow up on time, and close more deals—with practical automation in one place.
- AI lead scoring and pipeline visibility
- Built-in dialer, WhatsApp, and email automation
- Sales forecasting and RevOps-ready reporting
To build a sales dashboard in New Zealand, begin by deciding which sales metrics matter most for your business, such as total sales, sales by product or region, and pipeline stages. Collect your sales data from your CRM, spreadsheets, or sales records. Use a spreadsheet or a dashboard tool to create visual charts and tables that update regularly. This dashboard will help you track sales performance, identify bottlenecks, and forecast revenue.
Why this comes up / what goes wrong
Many small business owners in New Zealand struggle to keep track of their sales activities and results because they rely on multiple disconnected tools like text messages, emails, and spreadsheets. This scattered approach makes it hard to see which deals are progressing or stalling, leading to lost sales opportunities. Without a clear sales dashboard, owners cannot easily forecast revenue or prioritise follow-ups. Building a simple sales dashboard addresses these issues by consolidating key sales information into one view.
Step-by-step
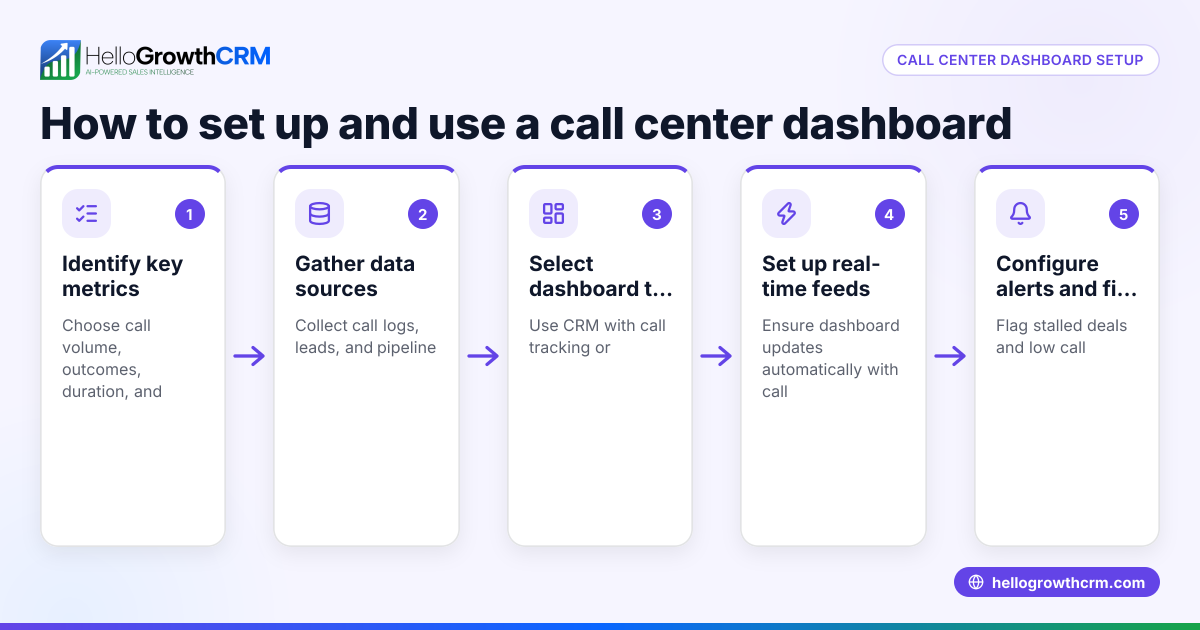
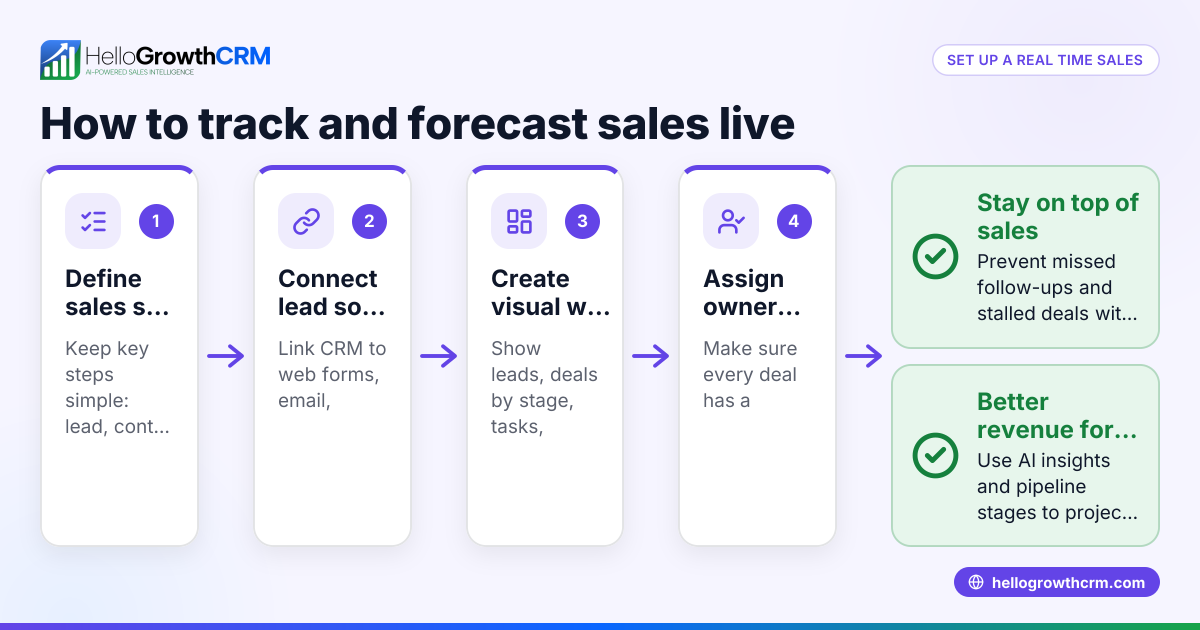
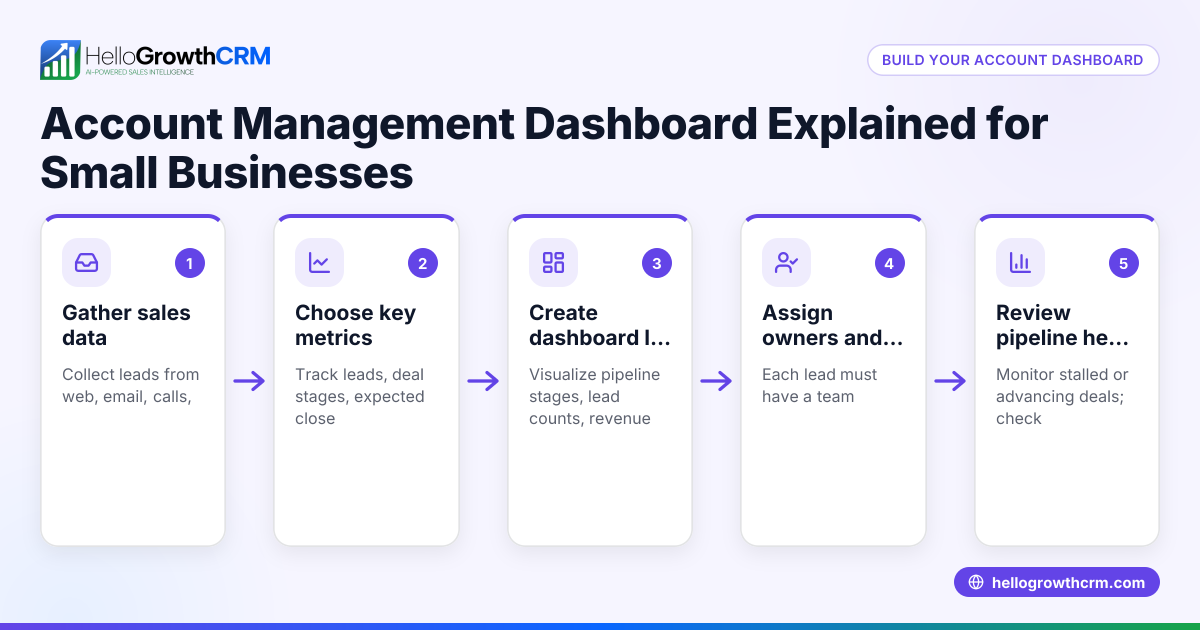
- Define your sales metrics: Decide which numbers you want to track daily or weekly. Common metrics include total sales value, number of deals in each pipeline stage, average deal size, and sales by territory or product.
- Gather your sales data: Collect the latest sales data from your existing sources—this might be your CRM, spreadsheets, emails, or WhatsApp messages. Ensure the data is accurate and up to date.
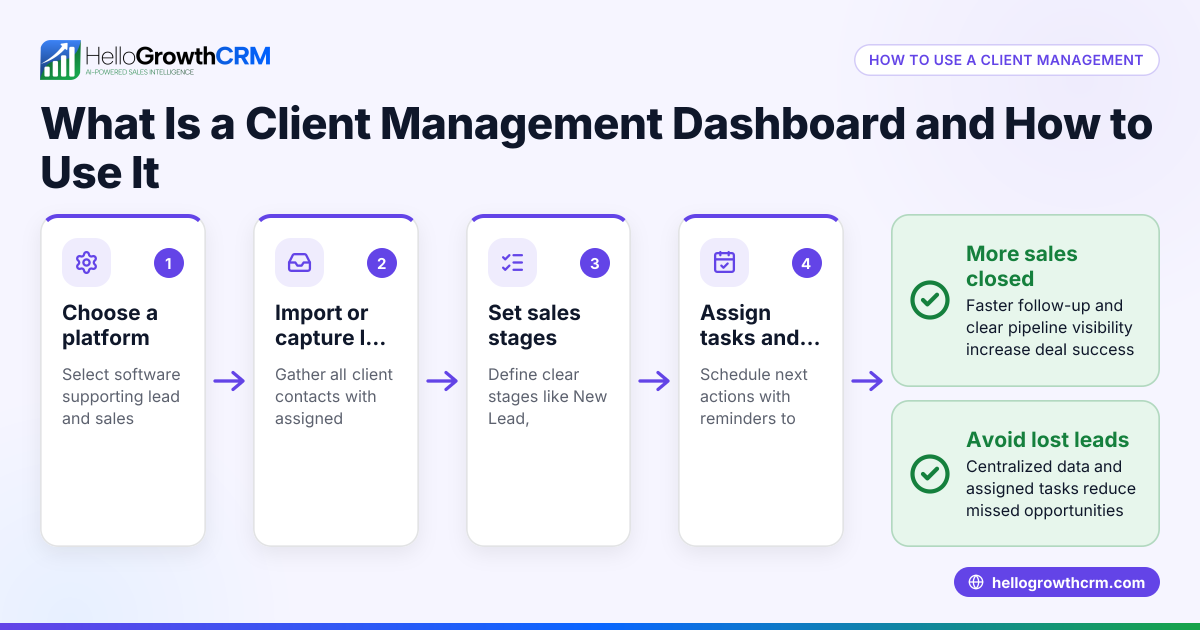
- Choose your dashboard tool: For many small businesses, a spreadsheet like Excel or Google Sheets is enough. If you want automated updates and AI insights, consider a CRM with built-in dashboard features.
- Create your data tables: Organise your sales data into tables showing deals by stage, sales by date, and sales by product or territory. Include columns for deal value, expected close date, and follow-up dates.
- Build visual charts: Use bar charts, pie charts, or line graphs to display your sales performance clearly. For example, a bar chart showing deals by pipeline stage helps identify where deals are stalling.
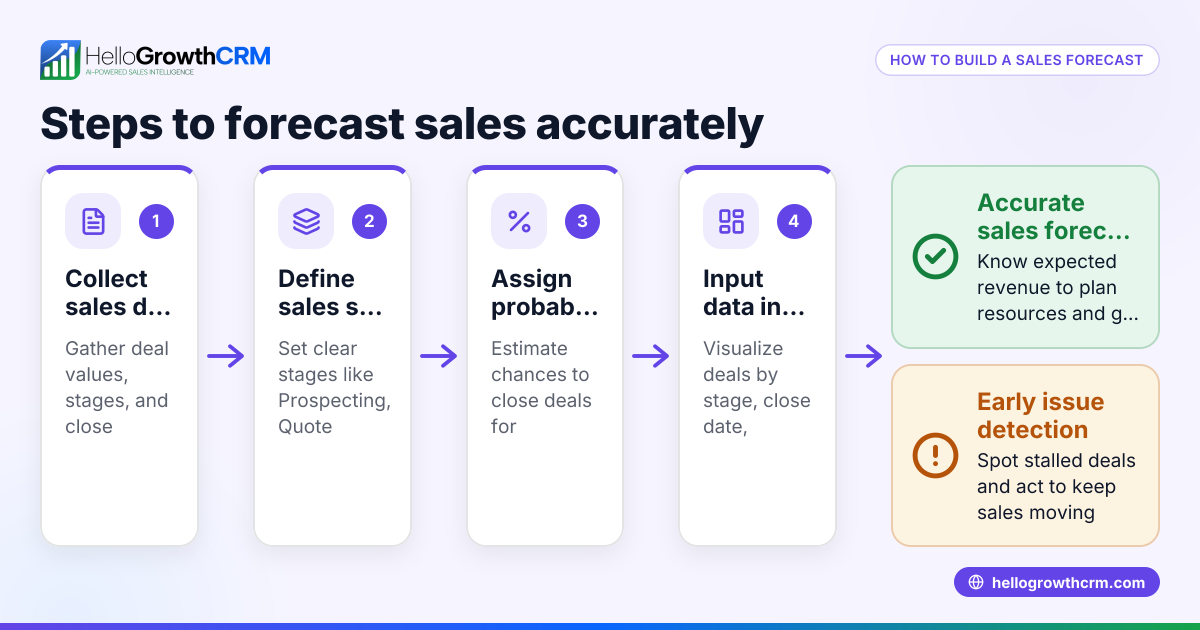
- Add sales forecasting: Calculate expected revenue by multiplying deal values by their probability of closing based on the pipeline stage. Sum these to get a forecast.
- Set up regular updates: Schedule weekly or daily updates to refresh the data and charts so your dashboard stays current.
- Review and adjust: Use the dashboard to spot bottlenecks or underperforming areas and adjust your sales activities accordingly.
Example (fictional figures)
Auckland-based real-estate agency wants to build a sales dashboard on 15/06/2024.
- They track 3 pipeline stages: Prospect, Quote Sent, and Negotiation.
- Deals:
- Prospect: 5 deals, each NZ$100,000 expected value, 20% probability
- Quote Sent: 3 deals, NZ$150,000 each, 50% probability
- Negotiation: 2 deals, NZ$200,000 each, 80% probability
Calculate expected revenue:
Prospect stage: NZ$100,000 × 5 = NZ$500,000 NZ$500,000 × 20% = NZ$100,000
Quote Sent stage: NZ$150,000 × 3 = NZ$450,000 NZ$450,000 × 50% = NZ$225,000
Negotiation stage: NZ$200,000 × 2 = NZ$400,000 NZ$400,000 × 80% = NZ$320,000
Total forecasted sales = NZ$100,000 + NZ$225,000 + NZ$320,000 = NZ$645,000
The agency creates bar charts showing the number of deals per stage and a line graph of forecasted revenue over the next quarter, updating weekly.
Common mistakes
- Tracking too many metrics: Focus on key sales numbers to avoid clutter. Prevent by listing only 3-5 critical metrics.
- Using outdated data: Regularly update your data to keep the dashboard accurate. Schedule weekly refreshes.
- Ignoring follow-ups: Without follow-up dates, deals can be forgotten. Use a CRM or calendar reminders.
- Not linking deals to pipeline stages: This makes forecasting unreliable. Always assign deals to clear stages.
- Overcomplicating visuals: Simple charts are easier to interpret. Use clear labels and avoid excessive colours.
- Relying solely on manual spreadsheets: This can lead to errors and delays. Consider a CRM with pipeline and forecasting features.
Doing this in HelloGrowthCRM
HelloGrowthCRM helps NZ small businesses build and maintain sales dashboards effortlessly. Its Deals (pipeline) feature tracks opportunities from first contact through to close, showing deals at each stage with follow-up dates so no quote is forgotten. The Pipeline forecast and AI insights provide automatic revenue forecasting and highlight where deals stall without needing to build spreadsheets. For businesses with field sales, Territories, field operations and commissions tools allow reps to log visits from their phones, giving managers a clear view of daily activity. Learn more about HelloGrowthCRM for New Zealand, its WhatsApp and SMS CRM, and the built-in CRM dialer.
Frequently asked questions
What sales metrics should I include in my dashboard? Focus on total sales, deals by pipeline stage, average deal size, sales by product or territory, and expected revenue forecasts. These metrics give a clear picture of performance and pipeline health.
How often should I update my sales dashboard? Update your dashboard at least weekly to keep the data fresh and actionable. More frequent updates may be needed if you have a fast-moving sales cycle.
Can I build a sales dashboard without a CRM? Yes, you can use spreadsheets like Excel or Google Sheets to build dashboards manually. However, a CRM can automate data collection, pipeline tracking, and forecasting, saving time and reducing errors.
How do I calculate sales forecasts from pipeline data? Multiply the value of each deal by its probability of closing based on the pipeline stage, then sum these to get the total forecast. This method estimates expected revenue more realistically.
What are the benefits of using HelloGrowthCRM for sales dashboards? HelloGrowthCRM offers pipeline tracking, AI-assisted forecasting, and field sales tools that keep sales data organised and visible. This reduces manual work and helps spot stalled deals early.
Key takeaways
- Identify and focus on key sales metrics like pipeline stages, deal values, and forecasted revenue.
- Collect accurate, up-to-date sales data from your CRM or spreadsheets.
- Use simple charts and tables to visualise sales performance and pipeline health.
- Calculate forecasts by multiplying deal values by closing probabilities.
- Update your dashboard regularly to keep it relevant.
- Avoid common mistakes like tracking too many metrics or ignoring follow-ups.
- Consider HelloGrowthCRM for automated pipeline tracking, AI insights, and field sales management.
Building a sales dashboard helps you track progress, forecast revenue, and prioritise sales efforts. Start now with a simple spreadsheet or explore HelloGrowthCRM’s features to simplify the process. Start on the Free Forever plan (200 leads, no credit card) today.
Ready to put this into practice?
Set up your pipeline, WhatsApp follow-ups, and AI lead scoring in minutes — free, no credit card.
Try HelloGrowthCRM freeGet CRM tips in your inbox
Join thousands of sales professionals who get weekly insights on CRM strategy, AI automation, and pipeline optimization.

The HelloGrowthCRM team publishes guides on CRM strategy, AI sales tools, and revenue operations for small business sales teams.