HelloGrowthCRM software
Built for real small-business sales teams
HelloGrowthCRM helps reps qualify faster, follow up on time, and close more deals—with practical automation in one place.
- AI lead scoring and pipeline visibility
- Built-in dialer, WhatsApp, and email automation
- Sales forecasting and RevOps-ready reporting
A monthly sales dashboard template for UK small businesses organises key sales data such as revenue, leads, conversion rates and pipeline stages on a monthly basis. It enables business owners and sales teams to track performance consistently, spot trends, and make informed decisions to improve sales outcomes. This article covers why small businesses search for such templates, how to build one step-by-step, a worked example with UK figures, common pitfalls to avoid, and how HelloGrowthCRM can help streamline sales tracking.
Why this comes up / what goes wrong
Small businesses in the UK often run sales processes manually using spreadsheets, emails and WhatsApp. Without a clear monthly sales dashboard template, they struggle to see how many leads turn into customers each month, which sales stages slow deals down, or whether sales targets are on track. This leads to missed follow-ups, lost revenue and unclear forecasts. A ready-to-use monthly sales dashboard template helps by providing a consistent format to capture and review these metrics without building complex spreadsheets from scratch.
Step-by-step
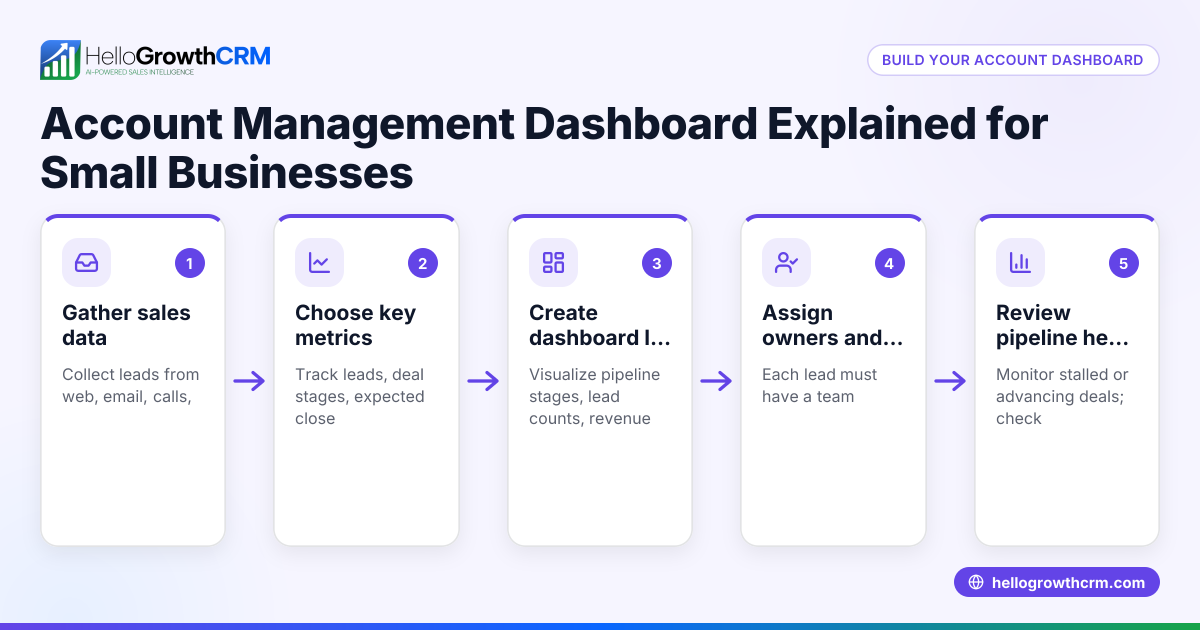
- Define your key sales metrics: Decide which monthly figures matter most. Typical metrics include total sales revenue, number of leads generated, number of deals closed, average deal size, conversion rate, and sales pipeline value.
- Set up a spreadsheet or use a template: Use Excel, Google Sheets or download a free sales template from HelloGrowthCRM's sales templates page. Ensure columns represent metrics and rows represent months.
- Collect data consistently: At the end of each month, update the dashboard with actual sales data. Check data sources such as your CRM, emails, or WhatsApp logs to ensure accuracy.
- Calculate derived metrics: For example, conversion rate = (deals closed ÷ leads generated) × 100. Check formulas carefully to avoid errors.
- Visualise trends with charts: Add line or bar charts to track monthly changes in revenue or conversion rates. Visualisation helps spot growth or decline.
- Review pipeline stages monthly: Track how many deals are at each stage (e.g., prospecting, quote sent, negotiation). Check for bottlenecks where deals stall.
- Set targets and compare actuals: Add a column for monthly sales targets and calculate variance to see if goals are met.
- Regularly update and share: Make the dashboard accessible to sales teams and review it in monthly meetings to align efforts.
Example (fictional figures)
A kitchen-fitting company in Leeds tracks its monthly sales for January 2024:
- Leads generated: 120
- Deals closed: 30
- Total sales revenue: £150,000
- Average deal size = £150,000 ÷ 30 = £5,000
- Conversion rate = (30 ÷ 120) × 100 = 25%
Calculations shown:
120 leads generated 30 deals closed £150,000 total sales revenue Average deal size = £150,000 ÷ 30 = £5,000 Conversion rate = (30 ÷ 120) × 100 = 25%
The dashboard rows for January 2024 would record these figures, with columns for each metric. Charts could show revenue and conversion trends over the year.
Common mistakes
- Inconsistent data updates: Failing to update the dashboard monthly leads to outdated insights. Prevent by scheduling a fixed monthly review.
- Mixing data sources without verification: Combining figures from WhatsApp, emails and spreadsheets can cause errors. Prevent by cross-checking data before entry.
- Ignoring pipeline stages: Only tracking closed sales misses opportunities to spot stalled deals. Prevent by including pipeline stage counts.
- Overcomplicating the dashboard: Adding too many metrics can overwhelm users. Prevent by focusing on key actionable metrics.
- Not setting targets: Without targets, it’s hard to judge performance. Prevent by adding realistic monthly goals.
- Failing to visualise data: Numbers alone are hard to interpret. Prevent by adding charts.
For more guidance, explore HelloGrowthCRM’s free sales tools and calculators to download templates without signing up.
Doing this in HelloGrowthCRM
HelloGrowthCRM offers free sales tools, templates and calculators accessible without an account, including follow-up cadence and pipeline templates to help small businesses organise sales data efficiently. Its pipeline forecast and AI insights feature shows which sales stages deals are stalling in, removing the need for complex spreadsheets. Deals in the pipeline are tracked from first contact to close, with quotations appearing at the 'quote sent' stage along with follow-up dates, ensuring no opportunity is forgotten. Learn more about HelloGrowthCRM for the United Kingdom here.
Frequently asked questions
What should a monthly sales dashboard include for a UK small business? A monthly sales dashboard should include key metrics like total sales revenue, number of leads, deals closed, average deal size, conversion rate, and pipeline stage counts. Including sales targets and variance helps measure performance.
Can I use Excel or Google Sheets for a sales dashboard? Yes, Excel and Google Sheets are common tools for sales dashboards. You can also download free sales templates from HelloGrowthCRM’s sales templates page to get started quickly.
How often should I update my sales dashboard? Update your sales dashboard at least once a month after closing the books for that period. Regular updates ensure insights are current and actionable.
How can I avoid errors when tracking sales data from WhatsApp and email? Cross-check data from WhatsApp, email, and spreadsheets before entering it into your dashboard. Use a CRM like HelloGrowthCRM to centralise communications and sales tracking, reducing manual errors.
Is there a free tool to help me build a sales dashboard? HelloGrowthCRM provides free sales tools and templates that can be downloaded without an account. These include pipeline and follow-up templates designed for small businesses.
Key takeaways
- Use a clear, simple monthly sales dashboard template to track key sales metrics.
- Update the dashboard consistently each month with accurate data.
- Include pipeline stage tracking to identify stalled deals.
- Set monthly sales targets and compare actuals to measure progress.
- Visualise data with charts for easier interpretation.
- Download free sales templates and tools from HelloGrowthCRM to get started.
Start organising your sales data effectively by downloading free templates and tools from HelloGrowthCRM. Start on the Free Forever plan (200 leads, no credit card) today to access these resources and improve your sales tracking.
Ready to put this into practice?
Set up your pipeline, WhatsApp follow-ups, and AI lead scoring in minutes — free, no credit card.
Try HelloGrowthCRM freeGet CRM tips in your inbox
Join thousands of sales professionals who get weekly insights on CRM strategy, AI automation, and pipeline optimization.

The HelloGrowthCRM team publishes guides on CRM strategy, AI sales tools, and revenue operations for small business sales teams.