HelloGrowthCRM software
Built for real small-business sales teams
HelloGrowthCRM helps reps qualify faster, follow up on time, and close more deals—with practical automation in one place.
- AI lead scoring and pipeline visibility
- Built-in dialer, WhatsApp, and email automation
- Sales forecasting and RevOps-ready reporting
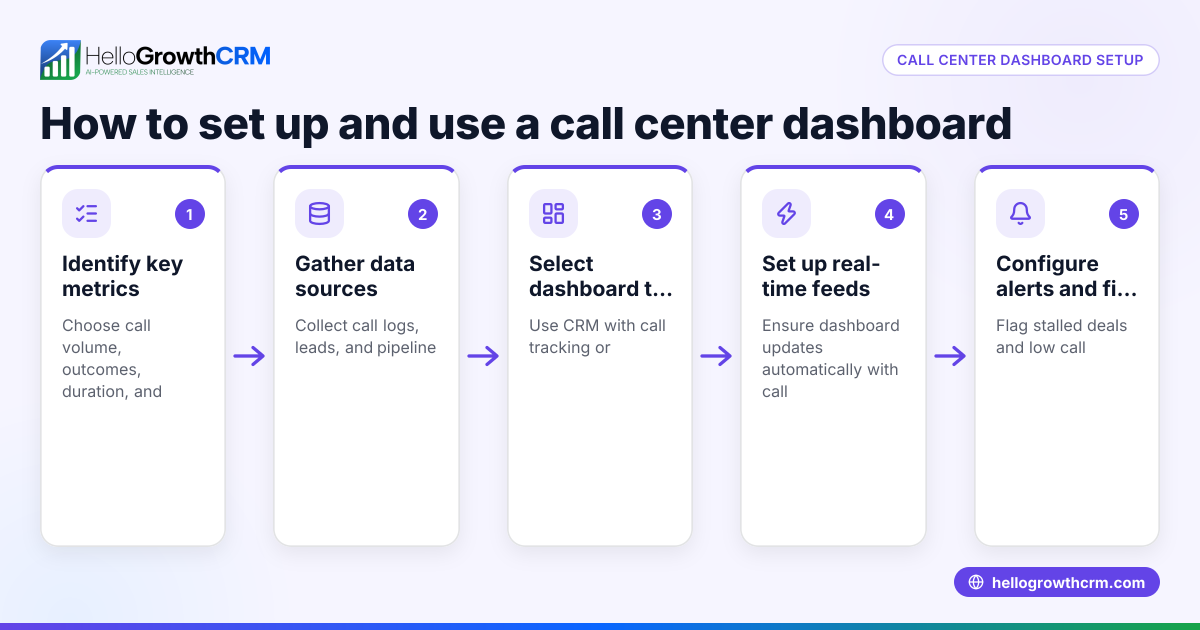
A monthly sales dashboard template USA is a ready-made format that helps you track and visualize your sales performance each month. It typically includes key metrics like total sales, leads, conversion rates, and pipeline stages. This article covers how to set up a monthly sales dashboard, provides a fictional example, highlights common mistakes to avoid, and points to free sales templates and tools to get started quickly.
Why this comes up / what goes wrong
Small-business owners in the US often search for a monthly sales dashboard template because they want a quick, organized way to monitor their sales progress without building a complex spreadsheet from scratch. Many run sales through email, text, or spreadsheets, which can lead to lost leads, slow follow-up, and unclear sales forecasts. Without a dashboard, it’s hard to spot where deals stall or to measure monthly performance accurately. A template provides a structured format to capture essential sales data, track pipeline stages, and forecast revenue.
Step-by-step
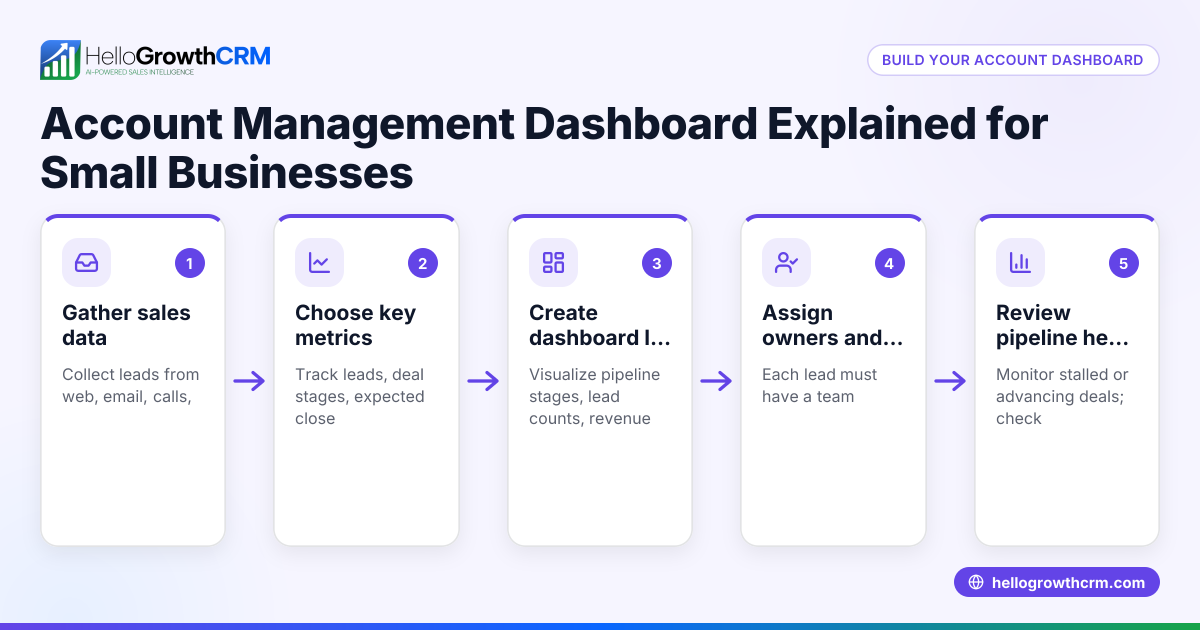
- Choose your key sales metrics to track. Common metrics include total monthly sales, number of leads, conversion rate, average deal size, and sales by product or service. Check that your chosen metrics align with your business goals.
- Select a dashboard format or tool. You can use Excel, Google Sheets, or download free sales templates and calculators from the free sales tools and calculators page. Ensure the format allows easy monthly updates and clear visualization.
- Set up your data sources. Gather sales data from your CRM, email, or spreadsheets. Check that data is accurate and up to date before inputting.
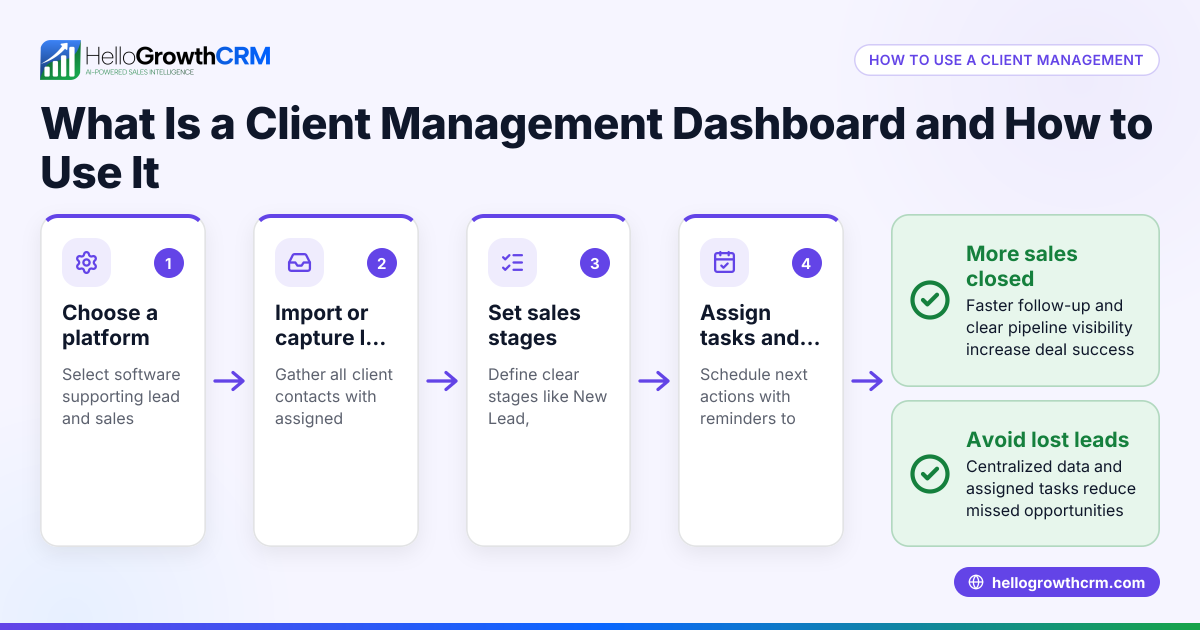
- Create sections for pipeline stages. Track deals by stages such as Lead, Contacted, Quote Sent, Negotiation, and Closed. Confirm each deal is assigned properly to a stage to avoid missing opportunities.
- Add formulas and charts. Use formulas to calculate totals, conversion rates, and monthly growth. Add charts like bar graphs or line charts for visual trends. Verify formulas work correctly by testing with sample data.
- Update the dashboard monthly. Schedule a monthly review to input new data and analyze results. Check for any missing deals or data entry errors.
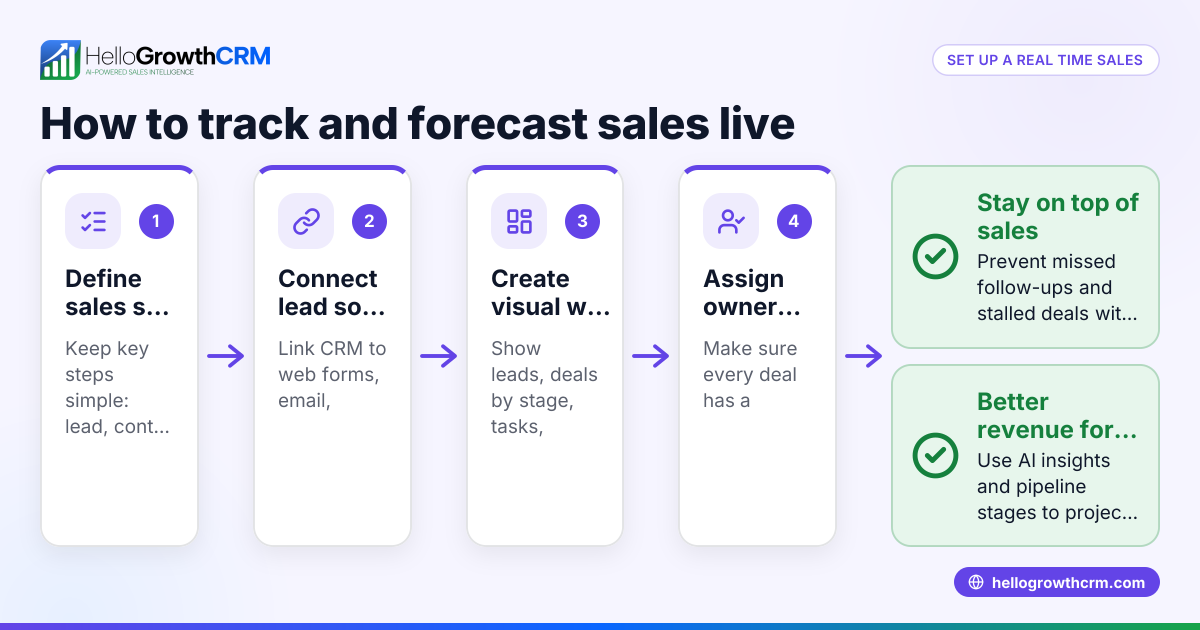
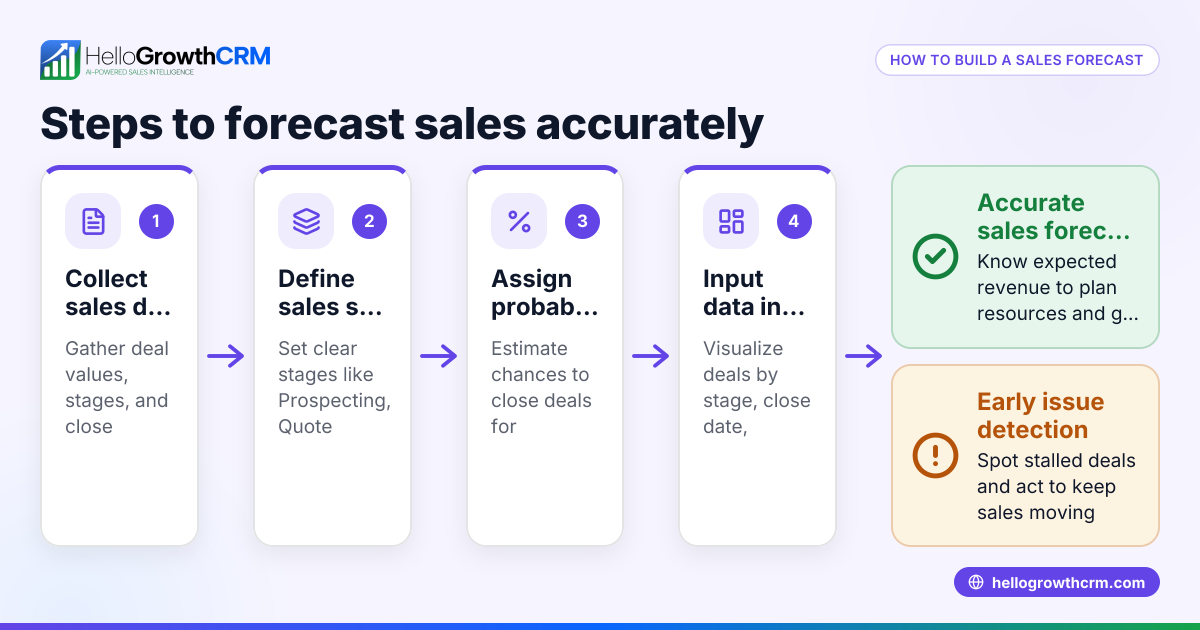
- Use the dashboard for sales forecasting. Based on pipeline stages and deal values, estimate expected revenue for the month ahead.
Example (fictional figures)
A landscaping contractor in Charlotte, North Carolina, tracks March 2024 sales.
- Total leads contacted: 120
- Leads converted to customers: 30
- Average deal size: $2,500
- Sales by stage:
- Lead: 40
- Contacted: 30
- Quote Sent: 20
- Negotiation: 15
- Closed: 15
Calculations:
Conversion rate = (Leads converted ÷ Total leads) × 100 Conversion rate = (30 ÷ 120) × 100 = 25%
Total sales = Number of closed deals × Average deal size Total sales = 15 × $2,500 = $37,500
Expected revenue from pipeline (assuming 50% close rate on Negotiation stage deals):
Deals in Negotiation = 15 Expected closes = 15 × 50% = 7.5 (round to 8) Expected revenue = 8 × $2,500 = $20,000
This dashboard helps the contractor see current sales and forecast revenue from deals in progress.
Common mistakes
- Ignoring data accuracy. Prevent by double-checking sales entries and pipeline stages before updating the dashboard.
- Tracking too many metrics. Focus on key metrics relevant to your business goals to keep the dashboard clear and actionable.
- Not updating regularly. Set a monthly reminder to update data and review progress.
- Missing pipeline stages. Ensure all deals are assigned to a stage to avoid lost opportunities.
- Overcomplicating formulas and visuals. Use simple formulas and clear charts to make insights easy to understand.
- Not using available free resources. Download free templates and tools from the sales templates page to simplify setup.
Doing this in HelloGrowthCRM
You can download free sales tools, templates, and calculators without creating an account, including pipeline templates and follow-up cadences, at free sales tools and calculators. The platform also offers pipeline forecast and AI insights that reveal which deal stages are stalling without building spreadsheets. Tracking deals through the pipeline is easy—such as a quotation sent last week appearing at the 'quote sent' stage with a follow-up date to ensure no opportunity is forgotten. Learn more about these capabilities at HelloGrowthCRM for the United States.
Frequently asked questions
What should a monthly sales dashboard include? A monthly sales dashboard should include key metrics like total sales, number of leads, conversion rates, average deal size, and pipeline stages. Visual charts help track trends and forecast future sales.
Can I use Excel or Google Sheets for my sales dashboard? Yes, Excel and Google Sheets are common tools for building sales dashboards. You can also download free ready-made templates from the free sales tools and calculators page to save time and avoid errors.
How often should I update my sales dashboard? Update your sales dashboard monthly to reflect the latest data. Regular updates help you track progress, spot stalled deals, and adjust sales strategies.
How do I avoid losing leads in my pipeline? Assign every lead to a pipeline stage and set follow-up dates. Using a CRM or pipeline template helps keep track of deals and prevents leads from falling through the cracks.
Can I forecast sales using a dashboard? Yes, by tracking deals in each pipeline stage and their expected close probabilities, you can estimate expected revenue for the month ahead.
Key takeaways
- Use a monthly sales dashboard template to track key sales metrics clearly and consistently.
- Focus on essential metrics like total sales, leads, conversion rates, and pipeline stages.
- Update your dashboard monthly and verify data accuracy to avoid errors.
- Download free sales templates and calculators from the free sales tools and calculators page to simplify setup.
- Assign deals to pipeline stages and set follow-up dates to prevent lost leads.
- Use dashboards to forecast expected revenue based on pipeline progress.
Start managing your sales more effectively today. Start on the Free Forever plan (200 leads, no credit card) to access free templates, pipeline tracking, and AI sales insights.
Ready to put this into practice?
Set up your pipeline, WhatsApp follow-ups, and AI lead scoring in minutes — free, no credit card.
Try HelloGrowthCRM freeGet CRM tips in your inbox
Join thousands of sales professionals who get weekly insights on CRM strategy, AI automation, and pipeline optimization.

The HelloGrowthCRM team publishes guides on CRM strategy, AI sales tools, and revenue operations for small business sales teams.