HelloGrowthCRM software
Built for real small-business sales teams
HelloGrowthCRM helps reps qualify faster, follow up on time, and close more deals—with practical automation in one place.
- AI lead scoring and pipeline visibility
- Built-in dialer, WhatsApp, and email automation
- Sales forecasting and RevOps-ready reporting
Sales graphs are charts or diagrams that display your sales figures visually, often over days, weeks, months, or by product categories. They make it easier to spot patterns like growth, seasonal dips, or which products sell best. For small business owners, sales graphs provide a clear snapshot of performance that numbers alone can’t show. This article covers why sales graphs come up for small businesses, how to create them step-by-step, a practical example with figures and calculations, common mistakes, and how HelloGrowthCRM can help you keep track of sales efficiently.
Why this comes up / what goes wrong
Small business owners often struggle to understand their sales trends because raw numbers in spreadsheets or email threads don’t tell the full story. Without visual aids like sales graphs, it’s hard to spot if sales are improving, declining, or staying flat. This can lead to missed opportunities or slow reactions to market changes. For example, a business owner might not notice a drop in sales for a key product line until it’s too late. Sales graphs help by turning complex data into easy-to-read visuals, enabling faster and better decisions.
Step-by-step
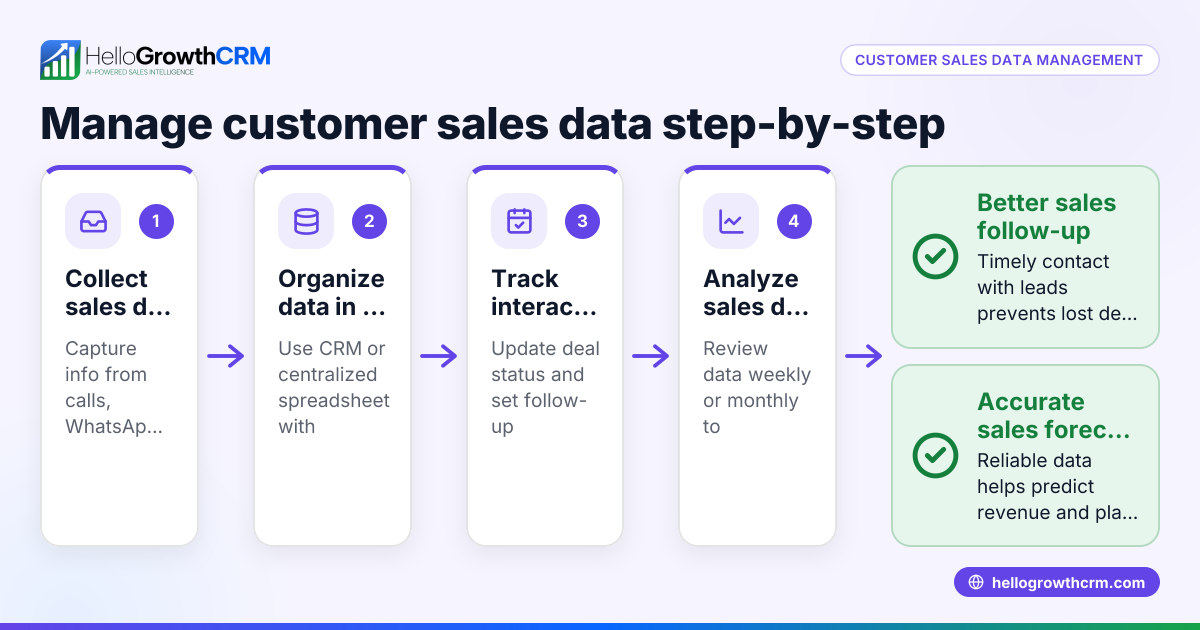
- Gather your sales data: Collect your sales information for the period you want to analyze. This could be daily, weekly, monthly, or quarterly sales figures, broken down by product, location, or sales rep.
- Choose the type of sales graph: Decide which graph suits your data and goal. Common types include line graphs for trends over time, bar charts for comparing categories, and pie charts for percentage shares.
- Use a tool to create the graph: You can use spreadsheet software like Excel or Google Sheets, or a CRM with reporting features. Input your data into the tool and select the graph type.
- Label your graph clearly: Add titles, axis labels, and legends so anyone can understand what the graph shows at a glance.
- Analyze the graph: Look for trends, spikes, dips, or patterns. Check if sales are increasing, which products or territories perform best, and if any follow-up actions are needed.
- Update regularly: Keep your sales graphs up to date to track progress and adjust your strategy as needed.
- Use sales graphs with your team: Share these visuals in meetings or reports to keep everyone aligned on performance and goals. Tools like HelloGrowthCRM’s WhatsApp and SMS CRM can help streamline communication.
Example (fictional figures)
A two-location dental practice in Columbus, Ohio, wants to track monthly patient sales revenue for the first quarter of 2024.
| Month | Location A Sales | Location B Sales | Total Sales |
|---|---|---|---|
| 01/2024 | $48,000 | $52,000 | $100,000 |
| 02/2024 | $45,000 | $55,000 | $100,000 |
| 03/2024 | $50,000 | $60,000 | $110,000 |
Calculations for total sales each month:
$48,000 + $52,000 = $100,000
$45,000 + $55,000 = $100,000
$50,000 + $60,000 = $110,000
To create a sales graph:
- Add the sales data to a spreadsheet.
- Select the data range including months and sales figures.
- Insert a line graph showing sales for Location A, Location B, and total sales.
This graph will show that total sales were steady in January and February, with a rise in March mainly due to Location B. The practice can decide to investigate what caused the increase in March and replicate it.
Common mistakes
- Using too much data at once: Overloading a graph with too many products or dates can make it hard to read. Prevent this by focusing on key categories or shorter time frames.
- Not labeling axes or legends: Without clear labels, graphs confuse viewers. Always add descriptive titles and labels.
- Ignoring updates: Old sales graphs don’t help decisions. Schedule regular updates to keep insights current.
- Relying on raw numbers only: Numbers alone don’t reveal trends. Use graphs to visualize data.
- Not sharing graphs with the team: Sales insights benefit everyone. Share graphs in meetings or dashboards using tools like HelloGrowthCRM’s built-in CRM dialer for better communication.
- Failing to link graphs to action: A graph without follow-up is wasted. Use insights to adjust sales tactics or priorities.
Doing this in HelloGrowthCRM
HelloGrowthCRM helps small businesses track sales with its Deals (pipeline) feature, where quotations sent appear as deals in the 'quote sent' stage with follow-up dates, so no opportunity is forgotten. For businesses with field sales, the Territories, field operations and commissions tools allow reps to log visits from their phones, letting managers see daily activity. Founders without a sales manager can use Managed RevOps to have a specialist handle follow-up queues weekly, keeping the sales pipeline clean and active. Learn more about HelloGrowthCRM’s WhatsApp and SMS CRM and its built-in CRM dialer to improve your sales tracking and communication.
Frequently asked questions
What types of sales graphs are most useful for small businesses? Line graphs are great for showing sales trends over time, bar charts help compare sales between products or locations, and pie charts show sales distribution percentages. Choose the type that best fits your data and goals.
How often should I update my sales graphs? Update sales graphs regularly based on your sales cycle—monthly or weekly is common for small businesses. Frequent updates help catch trends early and adjust strategies promptly.
Can I create sales graphs without special software? Yes, basic sales graphs can be created using free tools like Google Sheets or Excel. However, a CRM like HelloGrowthCRM can automate data capture and keep your sales pipeline organized, making graph creation easier.
How do sales graphs help improve sales performance? By visualizing data, sales graphs highlight what’s working and what’s not, enabling you to focus on high-performing products, improve weak areas, and plan follow-ups effectively.
What if I have multiple sales channels or locations? Segment your sales data by channel or location and use comparative graphs like grouped bar charts or stacked area charts to see how each performs. HelloGrowthCRM’s Territories, field operations and commissions tools help manage multiple locations and sales reps efficiently.
Key takeaways
- Sales graphs visually display your sales data to reveal trends and comparisons.
- Choose the right graph type based on your data and what you want to learn.
- Regularly update and share sales graphs to keep your team informed.
- Avoid clutter and label your graphs clearly for easy understanding.
- Use sales graphs to guide follow-up actions and improve sales strategies.
- HelloGrowthCRM offers tools like Deals pipeline and Territories to support sales tracking.
To start organizing your sales data and creating actionable sales graphs, try HelloGrowthCRM’s Free Forever plan with 200 leads and no credit card required at Start on the Free Forever plan (200 leads, no credit card).
Ready to put this into practice?
Set up your pipeline, WhatsApp follow-ups, and AI lead scoring in minutes — free, no credit card.
Try HelloGrowthCRM freeGet CRM tips in your inbox
Join thousands of sales professionals who get weekly insights on CRM strategy, AI automation, and pipeline optimization.

The HelloGrowthCRM team publishes guides on CRM strategy, AI sales tools, and revenue operations for small business sales teams.