HelloGrowthCRM software
Built for real small-business sales teams
HelloGrowthCRM helps reps qualify faster, follow up on time, and close more deals—with practical automation in one place.
- AI lead scoring and pipeline visibility
- Built-in dialer, WhatsApp, and email automation
- Sales forecasting and RevOps-ready reporting
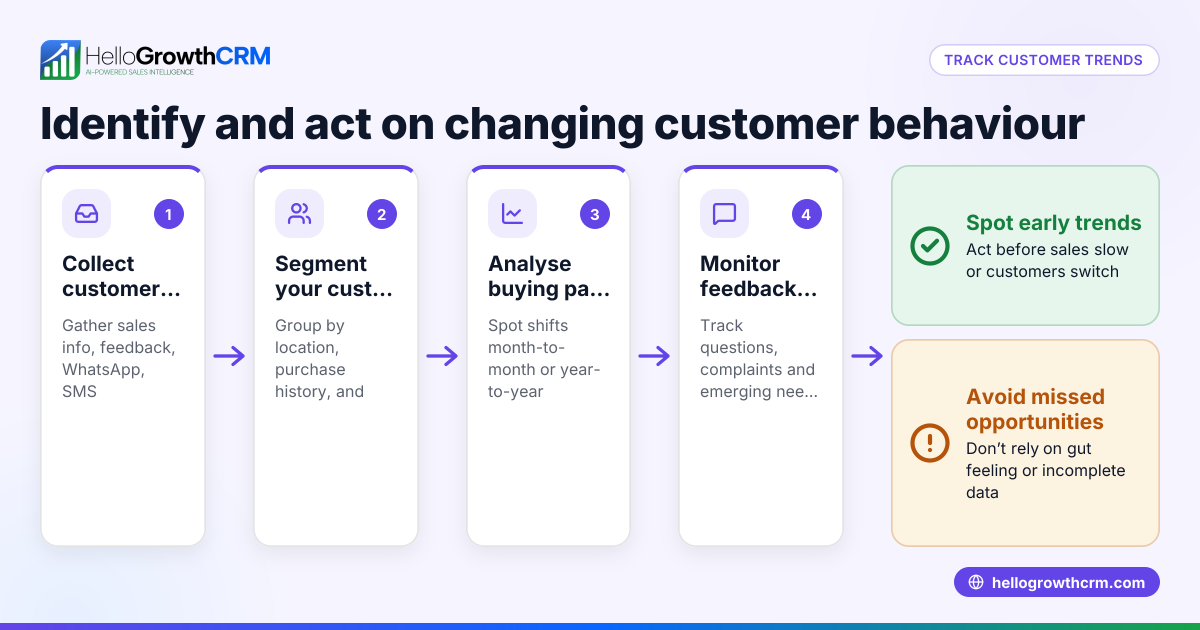
A sales trend is the pattern of your business's sales performance over time, revealing whether your sales are rising, falling, or holding steady. Recognizing these trends helps business owners adjust strategies, predict future revenue, and allocate resources wisely. This article covers why understanding sales trends is important, how to analyze them step-by-step, a worked example, common pitfalls to avoid, and how HelloGrowthCRM can help you track and act on your sales pipeline.
Why this comes up / what goes wrong
Small business owners often struggle to understand their sales trend because sales data is scattered across emails, text messages, and spreadsheets. Without a clear picture, it’s hard to tell if sales are improving or declining. This lack of insight can lead to missed opportunities, slow follow-up, and lost leads. For example, a founder might notice sales are down but can’t pinpoint if it’s due to fewer leads, longer sales cycles, or lost follow-ups. This confusion makes it difficult to take effective action.
Step-by-step
- Collect your sales data consistently. Gather sales figures for regular intervals—weekly, monthly, or quarterly. Check that your data includes total sales revenue, number of deals closed, and average deal size.
- Organize the data chronologically. Arrange sales numbers by date to see how they change over time. Use a spreadsheet or a CRM that shows deals in pipeline stages.
- Calculate sales metrics for each period. Look at total sales volume, number of deals won, and average deal value. Check for fluctuations or patterns.
- Visualize the trend. Create a line graph or bar chart to plot sales figures over time. This makes it easier to spot upward or downward trends.
- Analyze the causes. Review your sales activities alongside the data. Check if marketing campaigns, seasonality, or follow-up rates affected sales.
- Set benchmarks and goals. Use past sales trends to set realistic targets. Monitor if current sales meet these goals.
- Act on insights. If sales are declining, investigate pipeline stages for bottlenecks or slow follow-up. If sales are growing, identify what’s working and reinforce those actions.
You can manage these steps more effectively with tools like HelloGrowthCRM’s Deals (pipeline) to track open opportunities and follow-ups pipeline management.
Example (fictional figures)
A residential real-estate team in Phoenix, Arizona, tracks monthly closed sales revenue over six months:
- January (01/31/2026): $150,000
- February (02/29/2026): $165,000
- March (03/31/2026): $140,000
- April (04/30/2026): $180,000
- May (05/31/2026): $210,000
- June (06/30/2026): $190,000
Step 1: List monthly sales:
January = $150,000 February = $165,000 March = $140,000 April = $180,000 May = $210,000 June = $190,000
Step 2: Calculate monthly change:
February - January = $165,000 - $150,000 = $15,000 increase March - February = $140,000 - $165,000 = -$25,000 decrease April - March = $180,000 - $140,000 = $40,000 increase May - April = $210,000 - $180,000 = $30,000 increase June - May = $190,000 - $210,000 = -$20,000 decrease
Step 3: Visualize and interpret:
The team sees fluctuations but an overall upward trend from January to May, with a slight dip in June. They decide to investigate what caused the June dip and reinforce April-May strategies.
Common mistakes
- Ignoring data consistency. Incomplete or irregular sales data can mislead trend analysis. Prevent this by collecting sales data regularly and completely.
- Focusing only on total sales volume. Overlooking deal count or average deal size hides important details. Check all relevant metrics.
- Not considering external factors. Ignoring seasonality or marketing campaigns can cause misinterpretation. Always review sales activities alongside data.
- Failing to act on insights. Identifying a trend without follow-up wastes time. Set clear action plans based on your analysis.
- Relying on manual tracking only. Using spreadsheets and emails risks losing leads and slow follow-up. Use a CRM to keep sales organized and visible.
Explore how a built-in CRM dialer helps speed follow-up and track calls for better pipeline hygiene built-in CRM dialer.
Doing this in HelloGrowthCRM
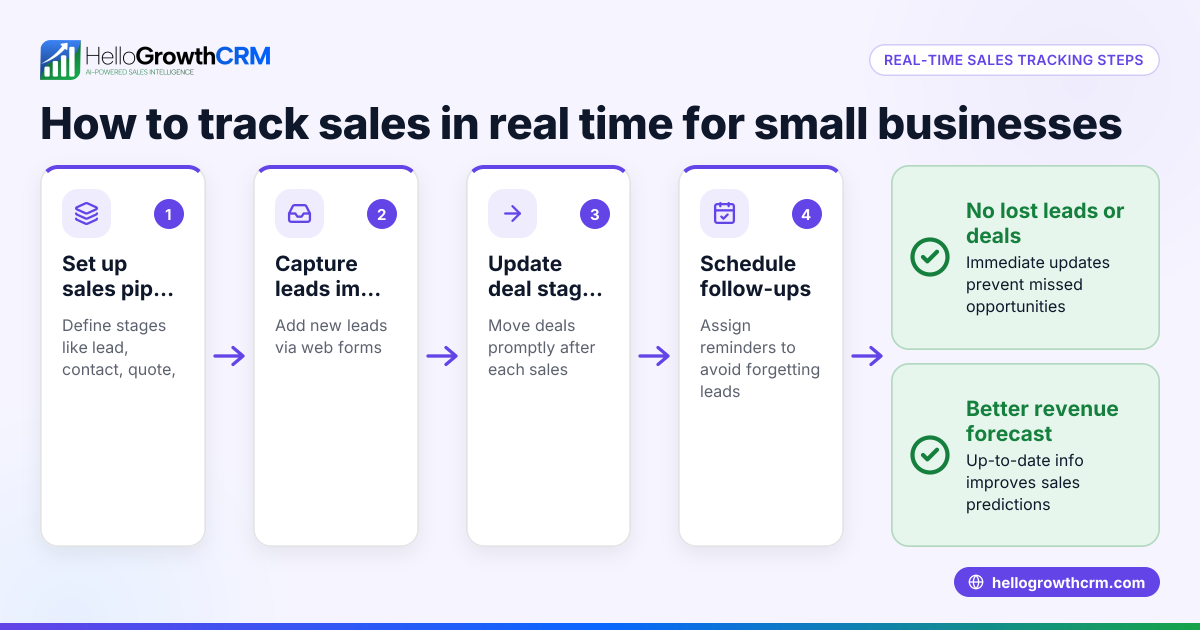
HelloGrowthCRM helps you track sales trends through its Deals (pipeline) feature. When you send a quotation, it creates a deal at the 'quote sent' stage with a follow-up date, ensuring no opportunity is forgotten. For field sales teams, the Territories, field operations and commissions tools let reps log visits from their phones, and managers can monitor daily activities. If you don’t have a dedicated sales manager, Managed RevOps provides weekly follow-up execution and pipeline cleanup so leads stay active and sales trends stay clear. Learn more about these features WhatsApp and SMS CRM.
Frequently asked questions
What is the difference between a sales trend and sales forecast? A sales trend shows historical sales patterns over time, while a sales forecast predicts future sales based on data and assumptions. Trends help understand what happened; forecasts guide planning.
How often should I review my sales trend? Review sales trends monthly or quarterly to spot changes early. More frequent reviews help if your sales cycle is short or you run active campaigns.
Can I track sales trends without a CRM? Yes, but it’s harder and less reliable. Manual tracking with spreadsheets risks errors and missed follow-ups. A CRM like HelloGrowthCRM centralizes data and automates reminders.
What metrics are most important for sales trend analysis? Key metrics include total sales revenue, number of deals closed, average deal size, and sales cycle length. Together they give a full picture.
How do I act on a negative sales trend? Identify pipeline stages where deals stall or follow-up is slow. Increase outreach, improve lead qualification, or adjust pricing and offers as needed.
Key takeaways
- A sales trend is the pattern of your sales performance over time, showing increases or decreases.
- Collect consistent, chronological sales data and analyze key metrics regularly.
- Visualize trends with charts to spot patterns and causes.
- Avoid common mistakes like inconsistent data and ignoring pipeline follow-up.
- HelloGrowthCRM’s Deals (pipeline), Territories, and Managed RevOps features help track and improve sales trends.
Start tracking your sales trend today to make smarter decisions and grow your business. You can start on the Free Forever plan (200 leads, no credit card) with HelloGrowthCRM.
Ready to put this into practice?
Set up your pipeline, WhatsApp follow-ups, and AI lead scoring in minutes — free, no credit card.
Try HelloGrowthCRM freeGet CRM tips in your inbox
Join thousands of sales professionals who get weekly insights on CRM strategy, AI automation, and pipeline optimization.

The HelloGrowthCRM team publishes guides on CRM strategy, AI sales tools, and revenue operations for small business sales teams.