HelloGrowthCRM software
Built for real small-business sales teams
HelloGrowthCRM helps reps qualify faster, follow up on time, and close more deals—with practical automation in one place.
- AI lead scoring and pipeline visibility
- Built-in dialer, WhatsApp, and email automation
- Sales forecasting and RevOps-ready reporting
A CRM forecasting dashboard for B2B sales teams is a live revenue view inside your CRM that replaces spreadsheet forecasting with structured pipeline data, weighted deal probabilities, stage-level coverage, and rep-level rollups so sales leaders can call commit, best-case, and gap-to-target with far less manual cleanup.
Key Takeaways
- A good forecasting dashboard starts with clean stage definitions, required deal fields, and clear exit criteria.
- Spreadsheets fail because they separate forecast reporting from daily sales execution.
- The most useful dashboard views are commit, best case, stage aging, coverage, and rep forecast accuracy.
- HelloGrowthCRM can tie forecasting to AI Pipeline Management, Sales Forecasting, and Managed RevOps so leaders get cleaner inputs without more admin work.
- Forecast accuracy improves when managers inspect stage velocity, close dates, next steps, and MEDDPICC-style qualification together.
- Teams under 50 reps can often standardize forecasting quickly. Larger orgs usually need stronger governance and territory controls.
Why B2B sales teams need a CRM forecasting dashboard instead of spreadsheets
A CRM forecasting dashboard for B2B sales teams is better than spreadsheets because it connects forecast numbers to the actual deals, stage movement, rep activity, and qualification data inside the selling system, which makes weekly forecast calls faster, more reliable, and easier to coach from.
The core problem with spreadsheets is not that they are flexible. It is that they are disconnected.
When a sales manager updates a spreadsheet on Friday, the file becomes a second system of record. Reps still work in email, meetings, and the CRM. Leaders then spend forecast reviews debating whose sheet is current instead of deciding what will close.
In practice, this creates five common failures:
- close dates drift without review
- stage names mean different things to different reps
- commit numbers are based on gut feel
- managers cannot see deal risk fast enough
- forecast accuracy gets worse late in the quarter
In one rollout we did with a 12-person sales team, the VP of Sales had three forecast files every Monday. One came from reps, one from managers, and one from finance. None matched the CRM. The fastest win was not a new formula. It was making forecast fields mandatory in the CRM and reviewing one live dashboard.
This shift matters because CRM adoption and forecast discipline are linked. Gartner’s CRM topic page consistently frames CRM value around better pipeline visibility, process consistency, and revenue decisions. That is exactly what a forecasting dashboard should support.
What a spreadsheet cannot show well
A spreadsheet can total deal values. It struggles to show operational causes.
A CRM dashboard can show:
- stage conversion by team and segment
- stage aging in days
- weighted forecast by probability band
- rep-level slippage
- missing next steps
- no-activity deals
- pipeline coverage against target
If you want a forecast that leaders trust, the forecast has to come from the same place reps manage deals. That is why many teams evaluating Features or a Free Trial are really trying to solve a forecasting problem, not just buy another CRM.
What a strong CRM forecasting dashboard should include
A strong CRM forecasting dashboard for B2B sales teams should include pipeline coverage, weighted forecast, commit and best-case categories, stage aging, close-date slippage, rep forecast accuracy, and drill-down views into missing qualification or activity so managers can act on risk, not just read totals.
Most dashboards fail because they only show one number. Good dashboards show both outcome and cause.
The five core forecast widgets
Start with these views:
- Pipeline by stage
- Show amount, deal count, and average age by stage.
- This reveals bottlenecks fast. - Weighted forecast
- Multiply deal amount by stage probability or forecast category.
- This gives a more realistic view than raw pipeline. - Commit, best case, and pipeline
- Separate deals expected to close from possible deals.
- Do not mix them into one total. - Rep forecast rollup
- Show each rep’s commit, best case, slippage, and activity coverage.
- This makes 1:1 coaching easier. - Gap to target
- Compare forecasted revenue to team goal.
- Add pipeline coverage ratio by month or quarter.
The supporting drill-down views
These are the views leaders often miss:
- deals with close date changed 2 or more times
- deals with no next meeting booked
- deals with no activity in the last 14 days
- deals missing MEDDPICC fields
- deals older than expected stage-velocity threshold
- deals with legal or procurement blockers
When I audit pipelines like this, the most accurate forecasts usually come from teams that review exceptions first. They do not start with total pipeline. They start with “what is stale, slipped, or under-qualified?”
The minimum data model
At a minimum, every opportunity should have:
- amount
- close date
- stage
- forecast category
- owner
- next step
- next meeting date
- lead source or channel
- customer segment
- qualification status
- last activity date
If you want deeper forecast confidence, add fields tied to Revenue Attribution, territory, buying committee size, and product line.
Which pipeline rules improve forecast accuracy the most
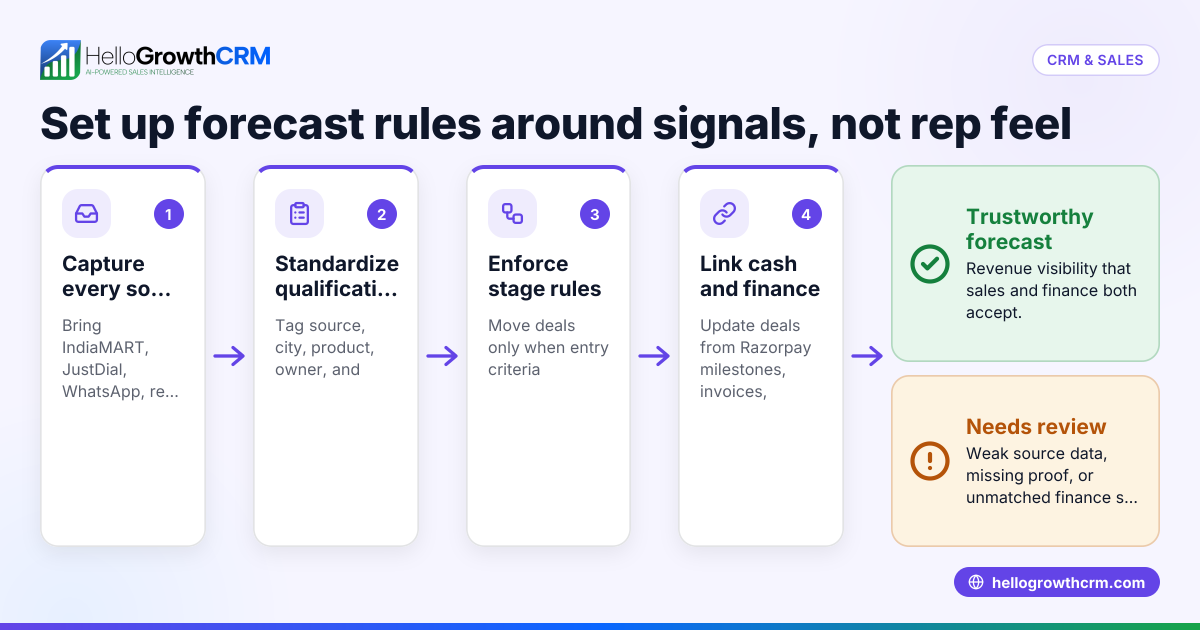
The pipeline rules that improve forecast accuracy the most are stage exit criteria, required fields for forecast categories, automatic stale-deal flags, close-date change tracking, and manager review rules that force reps to support commit deals with evidence instead of opinion.
Forecasting is a data quality problem before it is an analytics problem.
Stage definitions must be operational
Avoid vague stages like “Proposal” if nobody agrees on what it means.
Use stage rules such as:
- Discovery complete: pain, timeline, and decision process confirmed
- Qualified: MEDDPICC minimum fields complete
- Proposal sent: commercial terms delivered and reviewed live
- Commit: decision criteria met, next step booked, no unresolved blocker
- Closed won/lost: reason captured
That last point matters. Loss reasons help you improve future forecast quality and support better Sales Forecasting models.
Make forecast categories evidence-based
For example:
| Forecast Category | Required Evidence | Typical Use |
|---|---|---|
| Pipeline | Basic qualification only | Early deals not ready for a call |
| Best Case | Mutual next step, active champion, realistic timeline | Possible this period |
| Commit | Verbal alignment, decision process confirmed, close plan active | Expected this period |
| Closed | Contract executed or lost reason captured | Final outcome |
This table is simple, but it changes behavior. Reps learn that a commit is not a feeling. It is a status supported by facts.
Add automated guardrails
HelloGrowthCRM can reduce manual policing when you pair your dashboard with AI Deal Insights, AI Lead Scoring, and Sales Task Boards.
Useful automations include:
- flag deals with missing next steps
- alert managers in Slack when commit deals slip
- create tasks when close dates move beyond month end
- score risk when activity drops
- route post-call notes from Google Meet or Microsoft Teams into the record
According to Harvard Business Review’s sales topic coverage, disciplined sales process and manager coaching remain major drivers of performance. A forecasting dashboard works best when it reinforces both.
How to set up a CRM forecasting dashboard for B2B sales teams: Step-by-Step
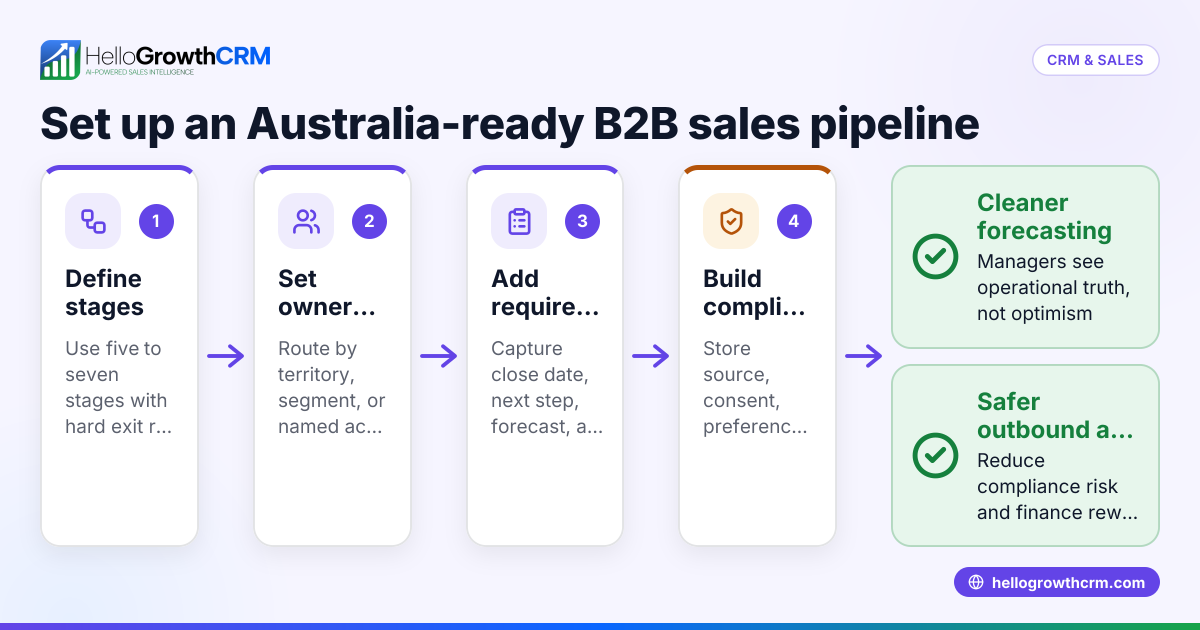
Setting up a CRM forecasting dashboard for B2B sales teams means standardizing opportunity data, defining stage rules, building forecast categories, adding risk views, and creating rep and manager workflows so the dashboard reflects live selling behavior instead of becoming another reporting layer.
- Define your forecast objective
Decide whether the dashboard is for weekly commit calls, monthly board reporting, or rep coaching. One dashboard can serve all three, but the primary use case should drive layout and metrics. - Clean up pipeline stages
Reduce overlap between stages. Give each stage a clear entry rule and exit rule. If two managers interpret a stage differently, fix that before building charts. - Set required opportunity fields
Make amount, close date, forecast category, next step, and next meeting mandatory. In HelloGrowthCRM, this is where your AI CRM setup starts to pay off because the system can prompt reps inside their daily workflow. - Add qualification fields
Track MEDDPICC or your preferred framework. At minimum, capture pain, champion, decision process, and timeline. This improves both forecast confidence and manager coaching. - Create forecast categories
Use Pipeline, Best Case, Commit, and Closed. Define what evidence each category needs. Keep categories simple enough for rep adoption. - Set probability logic
Use stage-based weighting first. Adjust later using historical conversion rates if you have enough data. If your history is weak, do not over-model. - Build the dashboard views
Include stage pipeline, weighted forecast, rep rollups, slippage, aging, and gap-to-target. Add filters by segment, region, and manager. - Add risk alerts and automations
Use alerts for no activity, slipped close dates, and missing next steps. Pair this with Smart Inbox, Meeting Scheduler, or Email Automation to help reps act quickly. - Run a weekly forecast cadence
Review commit first. Then review best case. Finally inspect stale deals and slipped dates. Keep calls focused on decisions and coaching, not data cleanup. - Measure forecast accuracy monthly
Compare commit, best case, and actual closed revenue by rep and manager. Then refine stage probabilities and category rules.
Recommended dashboard layout in HelloGrowthCRM
A practical layout for most B2B teams looks like this:
- top row: quota, forecast, gap to target, pipeline coverage
- second row: weighted pipeline by stage, commit by rep
- third row: aging by stage, close-date slippage
- fourth row: missing next steps, no recent activity, qualification gaps
If your team also uses CRM ROI Calculator or Pipeline Health Score, you can align forecast reviews with broader RevOps improvement work.
How HelloGrowthCRM helps replace spreadsheet forecasting without extra admin
HelloGrowthCRM helps replace spreadsheet forecasting without extra admin by combining required deal fields, live pipeline updates, AI-assisted risk detection, rep workflow automation, and managed RevOps support so leaders get a trustworthy forecast from normal CRM usage rather than a separate reporting exercise.
This is where many CRM projects fail. They ask reps to do extra reporting work. Forecast quality gets worse because adoption drops.
HelloGrowthCRM is built to reduce that burden.
Execution inside the CRM
With HelloGrowthCRM, forecasting can connect directly to:
- AI Pipeline Management for stage health and bottleneck visibility
- Sales Forecasting for rollups and probability views
- AI Sales Copilot for rep guidance on next actions
- Customer Health Score if expansion forecasting matters
- Territory Management for regional and account assignment clarity
If your team lives in inboxes and meetings, Gmail, Calendly, and All Integrations help keep activity synced without manual logging.
Managed RevOps support for teams that need faster setup
Not every sales leader wants to design forecast logic alone. That is where Managed RevOps matters.
This support is useful when:
- your stage definitions are inconsistent
- your CRM has adoption issues
- your board wants a more reliable forecast quickly
- sales and finance disagree on revenue views
- your managers need a tighter forecast cadence
I should be transparent here: HelloGrowthCRM is the product behind this recommendation. That means this article reflects our point of view. It also means we see the implementation patterns up close. In several mid-market setups, the biggest gains came from simple governance changes, not complex AI. Required next-step fields and slippage alerts often improved forecast confidence before advanced scoring did.
Limitations to keep in mind
This approach works especially well for SMB and mid-market B2B teams. For organizations above 50 to 100 reps, expect more complexity around overlays, territories, product families, and multi-region forecasting. Those teams usually need stricter permission design and finance alignment.
Common mistakes when replacing spreadsheet forecasting
The most common mistakes when replacing spreadsheet forecasting are copying spreadsheet logic into the CRM, keeping vague stage definitions, asking reps for duplicate updates, and building dashboards before fixing required fields, which leads to cleaner visuals but not better forecast accuracy.
Four mistakes to avoid
- Too many forecast categories
If reps cannot explain the difference, collapse them. - No owner for data quality
Someone must own field rules, review cadences, and reporting standards. - Using activity as a proxy for deal quality
High activity does not mean strong qualification. Use both. - Skipping manager enablement
Forecasting discipline spreads through managers first, not dashboards.
A useful self-check is to ask whether your dashboard can answer these questions in under two minutes:
- What will close this month?
- What is at risk?
- Which rep forecast is least reliable?
- Where is pipeline aging?
- How far are we from target by segment?
If the answer is no, the dashboard is not finished.
A better option is to start with a focused setup in HelloGrowthCRM, validate the workflow with one manager team, and then expand. If you want to see how this looks in practice, explore Pricing or book a Demo to map your current spreadsheet process into a cleaner CRM forecast model.
If your B2B team is still running pipeline reviews from spreadsheets, now is the right time to move forecasting into the system where selling already happens. Try HelloGrowthCRM to build a live forecasting dashboard with cleaner data, less admin, and support from our Managed RevOps team.
About the author
Arjun Mehta is a Sales Operations Lead at HelloGrowthCRM with 10 years of experience in B2B SaaS revenue operations. He has led CRM redesigns, forecasting rollouts, and pipeline governance projects for growth-stage sales teams. One project that shaped this article was a forecasting rebuild for a multi-region SaaS company that replaced weekly spreadsheet calls with stage-based CRM dashboards and cut manual forecast prep time dramatically.
Frequently Asked Questions
Q: What is a CRM forecasting dashboard for B2B sales teams?
A: A CRM forecasting dashboard for B2B sales teams is a live CRM view that shows expected revenue using deal stages, weighted probabilities, rep rollups, and pipeline risk indicators. It replaces offline spreadsheets with real-time data tied to actual sales execution.
Q: Why are spreadsheets bad for B2B sales forecasting?
A: Spreadsheets are bad for B2B sales forecasting because they create a second version of the truth outside the CRM. That leads to stale data, manual updates, inconsistent stage logic, and forecast meetings spent reconciling numbers instead of making decisions.
Q: Which metrics should a sales forecasting dashboard include?
A: A sales forecasting dashboard should include weighted pipeline, commit, best case, stage aging, close-date slippage, rep forecast accuracy, and gap to target. The best dashboards also show missing next steps, no-activity deals, and qualification gaps.
Q: How do I improve forecast accuracy in my CRM?
A: You improve forecast accuracy in your CRM by standardizing stages, requiring key deal fields, defining evidence-based forecast categories, and reviewing slippage weekly. Manager coaching and stale-deal alerts usually improve accuracy faster than adding more charts.
Q: What fields are required for CRM forecasting?
Frequently Asked Questions
Ready to put this into practice?
Set up your pipeline, WhatsApp follow-ups, and AI lead scoring in minutes — free, no credit card.
Try HelloGrowthCRM freeGet CRM tips in your inbox
Join thousands of sales professionals who get weekly insights on CRM strategy, AI automation, and pipeline optimization.

The HelloGrowthCRM team publishes guides on CRM strategy, AI sales tools, and revenue operations for small business sales teams.