Analytics Dashboard
Advanced analytics with conversion funnels and caller performance reporting for revenue teams.
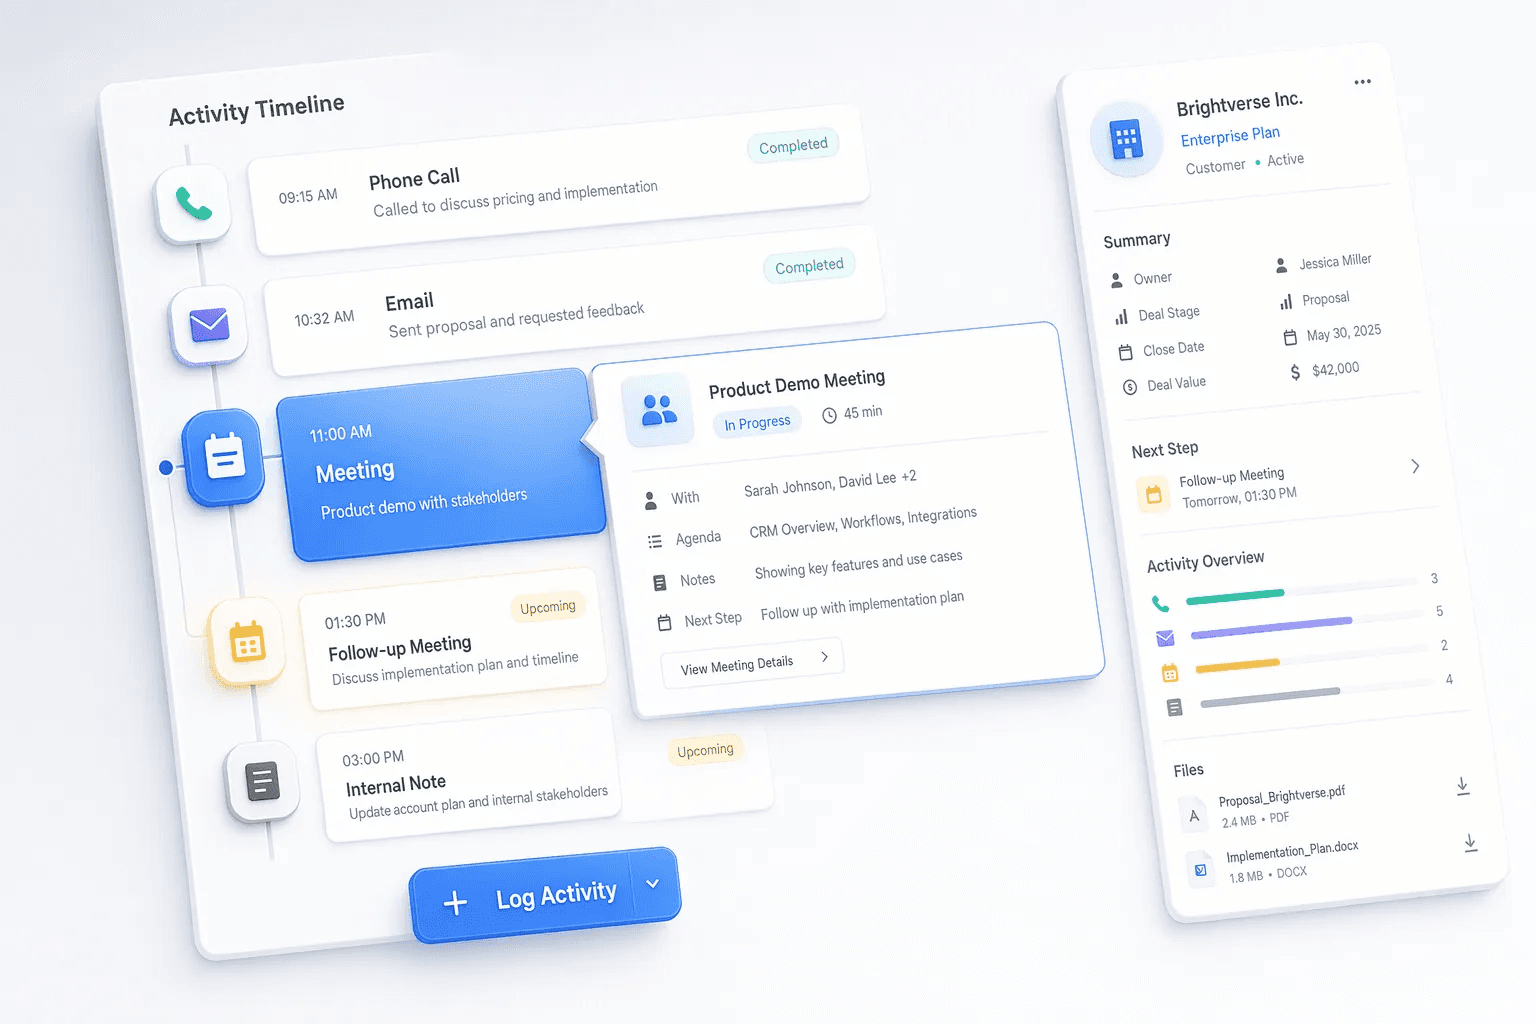


Measure what moves revenue.
Logged every day
- Calls & messages
- Deal stage changes
- Wins & losses
CRM analytics
Live dashboards
- Filter by rep, source, period
- Stage-by-stage conversion
- Trends over time
KPIs
- Win rate & conversion rate
- Sales cycle length
- Activity per rep
- Pipeline coverage & forecast
Quick navigation
Problem this feature solves
Teams usually evaluate Analytics Dashboard when workflow delays, inconsistent follow-up, or low visibility starts hurting conversion.
Analytics Dashboard is usually evaluated when teams want to remove friction from a repeated part of the revenue workflow. Instead of handling that step through memory, spreadsheets, or disconnected tools, this capability gives the team a more structured way to complete the work inside the CRM.
Advanced analytics with conversion funnels and caller performance reporting for revenue teams. In most cases, the real value appears when this feature is used together with the rest of analytics & reporting, because that is what keeps ownership, follow-up, and reporting connected to the same record.
Teams rarely adopt Analytics Dashboard completely on its own. It usually works best alongside related capabilities such as Activity Heatmap, Competitor Tracking, Pipeline Forecasting, which provide the surrounding workflow, visibility, or automation needed to make the feature operationally useful.
- Conversion funnel reporting across pipeline stages
- Caller performance visibility for activity and outcomes
- Updated funnel badges now hide undefined 0/0 conversion states
- Safer reporting behavior avoids misleading 100% values
Feature interaction and workflow impact
Advanced analytics with conversion funnels and caller performance reporting for revenue teams. This capability is part of the Analytics & Reporting category — reporting, forecasting, dashboards, and intelligence layers that help teams understand pipeline health, activity patterns, and performance trends.
Buyers should look at whether this feature reduces admin overhead for the frontline team while also improving inspection for managers. A feature is only truly useful when it helps the next action happen faster and leaves cleaner context behind for the person who reviews, approves, or follows up after it.
More in Analytics & Reporting
Explore the other 9 capabilities in this category.
This is useful when your team is deciding whether the current feature is enough on its own or whether the broader category is the real buying unit. In many CRM rollouts, the surrounding workflow matters as much as the individual capability.
Activity Heatmap
Visual heatmaps show when team activity is highest so leaders can spot effective windows and gaps.
Competitor Tracking
Track competitor mentions across calls and conversations to improve positioning and enablement.
Pipeline Forecasting
Forecast revenue and analyze pipeline trends to predict outcomes, gaps, and risk earlier.
Dashboard
Main dashboard providing a daily overview of performance, tasks, activity, and key metrics.
Goal & Quota Tracking
Set, monitor, and report on individual and team quotas to keep revenue targets visible and accountable.
Win Rate & Deal Velocity
Track how often deals close and how fast they move so teams find bottlenecks and improve conversion.
Rep Performance & KPI Dashboards
Track every rep's activity KPIs — calls, emails, deals moved, follow-ups completed — with leaderboards and coaching flags.
Growth Audit (SEO + CWV + Competitive)
Free growth audit tool — scan your site's Core Web Vitals, SEO health, and competitive position. Generates a shareable PDF report.
Call Insights & Sentiment Analysis
Analyse every call for sentiment, talk ratio, competitor mentions, and objection patterns — across your entire team.
Explore all feature categories
HelloGrowthCRM includes 121 capabilities across 14 categories.
Ready to use Analytics Dashboard?
Get started free — no credit card required.
← Back to Analytics & Reporting · All feature categories · Pricing