RevOps Audit
Forecast Accuracy Audit(Free Download)
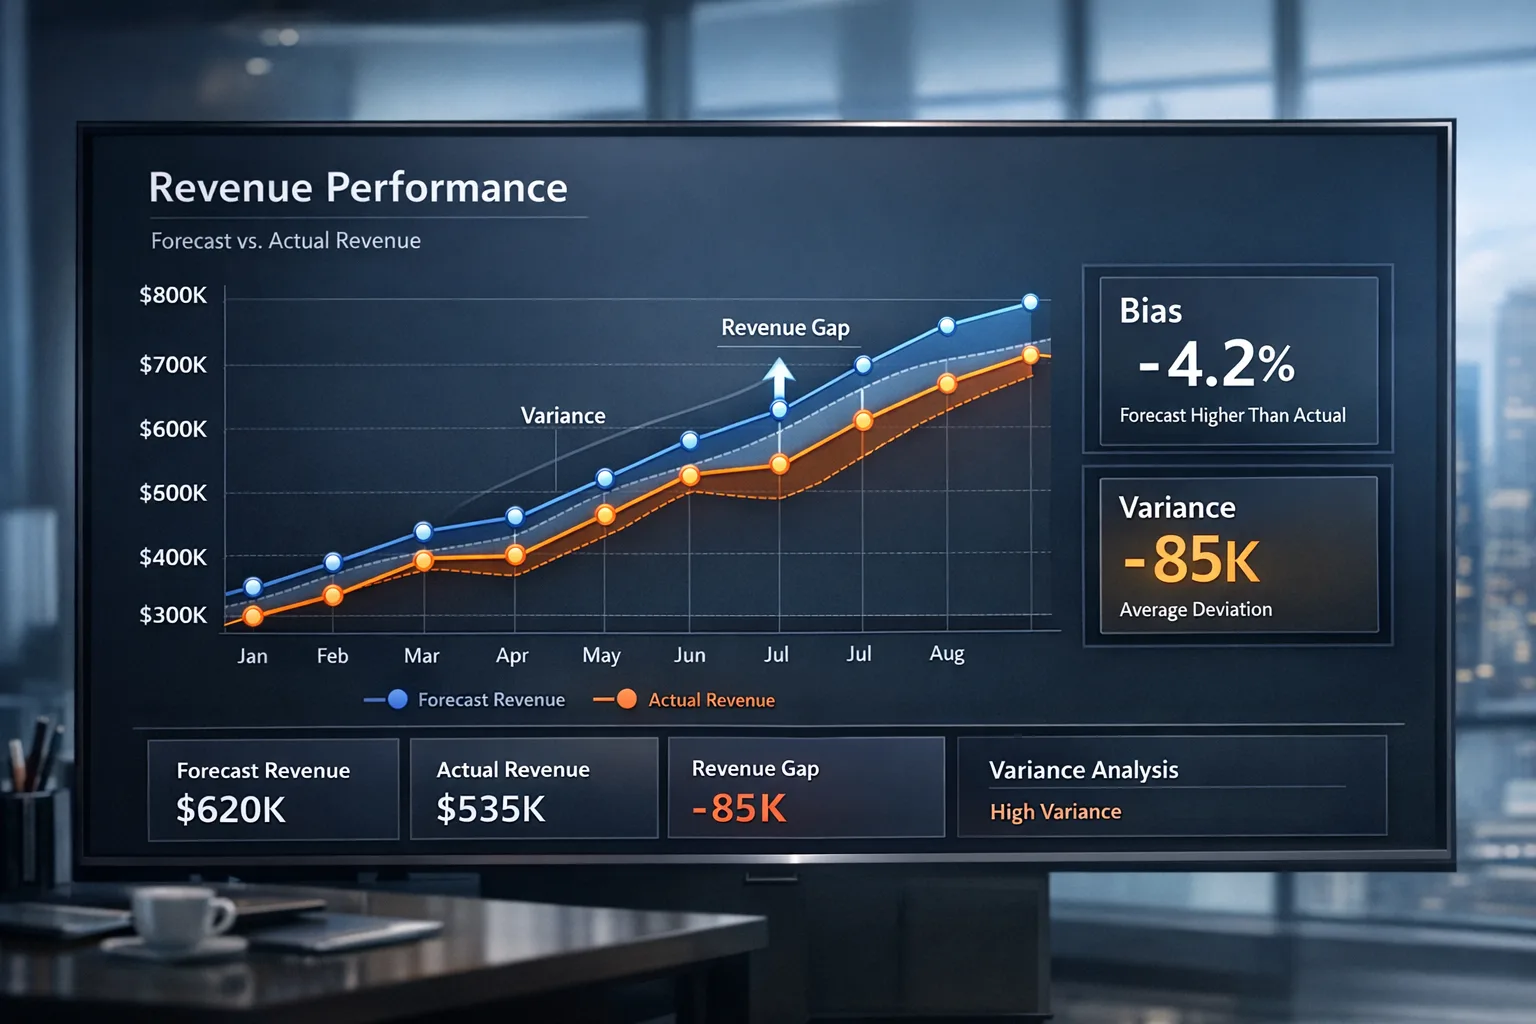
Compare forecast vs actual by period, quantify error and bias, and improve confidence with methodology and root-cause diagnostics.
Template preview
Forecast accuracy audit
What's included
Overview, period table, accuracy & bias calculations, segmented analysis, methodology scoring, RCA workspace, auto recommendations, and action plan with CSV export.
period Rows4
segment Rows4
methodology Checks6
Automation rules
- Flags systematic over/under-forecast from bias %
- Generates recommendations when MAPE, bias, or methodology score breach thresholds
Dashboards & views
- Forecast vs actual
- Accuracy scorecards
- Bias diagnostics
- Segment analysis
- RCA & plan
Template specs
Difficulty
Advanced
Setup time1–2 hours
IndustryUniversal
Plan required
Free
Updated 2026-04-09
No credit card · Free forever
Interactive audit template for RevOps, Sales Ops, and Finance teams to evaluate forecasting reliability across months/quarters. Includes forecast-vs-actual table (variance Rs / %, accuracy %), core calculations (MAPE, weighted accuracy, bias %), over/under-forecast classification, segmented analysis (rep/team, stage, deal size, time horizon), methodology assessment (historical baseline, coverage ratio, forecast categories, scenarios), root-cause framework (pipeline, sales behavior, process, data), and auto recommendations with action plan. Exports CSV for Excel/Google Sheets/Notion/PDF workflows.
The Problem This Solves
Forecast calls often mix intuition and inconsistent criteria, leading to high variance, hidden bias, and low confidence in revenue planning.
Who It's For
RevOps, Sales Ops, Finance/FP&A, CRO office, and regional sales leaders accountable for forecast quality.
Use Cases
- Compare forecast vs actual across months/quarters and detect trend drift
- Identify systematic over-forecasting or under-forecasting bias
- Pinpoint segment-level weaknesses by rep, stage, deal size, and horizon
- Standardize forecast methodology and governance for planning cycles
How to Use This Template
- 1
Enter period forecast and actual values from your forecast snapshots
- 2
Review MAPE, weighted accuracy, bias %, and classification
- 3
Fill segmented rows to isolate where error concentrates
- 4
Score methodology controls and capture root causes
- 5
Export CSV and assign actions for the next forecast cycle
Inside the template: sample data
The exact rows that ship with the Forecast Accuracy Audit download — replace them with your own records after import.
| Period | Forecast | Actual | Variance % | Accuracy % |
|---|---|---|---|---|
| Q1 | 1200000 | 1050000 | 14.3 | 85.7 |
| Q2 | 1400000 | 1380000 | 1.4 | 98.6 |
| Q3 | 1100000 | 1250000 | -12.0 | 88.0 |
| Q4 | 1600000 | 1520000 | 5.3 | 94.7 |
Frequently Asked Questions
Ready to use this template?
Deploy Forecast Accuracy Audit in HelloGrowthCRM with one click. Get started free — no credit card · free forever.
Free forever · No credit card required · Set up in minutes
Related resources
Related Templates
Sales Forecasting Model
Multi-method forecasting model combining weighted pipeline, historical trends, and rep-level predictions for accurate revenue forecasts.
Reporting & Metrics Audit
Consulting-grade audit: 40 criteria across data accuracy, reporting coverage, metric alignment, and dashboard adoption—normalized scores, health bands, gap analysis, and CSV export.
RevOps Maturity Assessment
Consulting-grade RevOps scorecard with 50 criteria across People (12), Process (13), Technology (12), and Data (13), using a 0–5 scale with automated 0–100 normalization.