Sales Forecasting Model(Free Download)
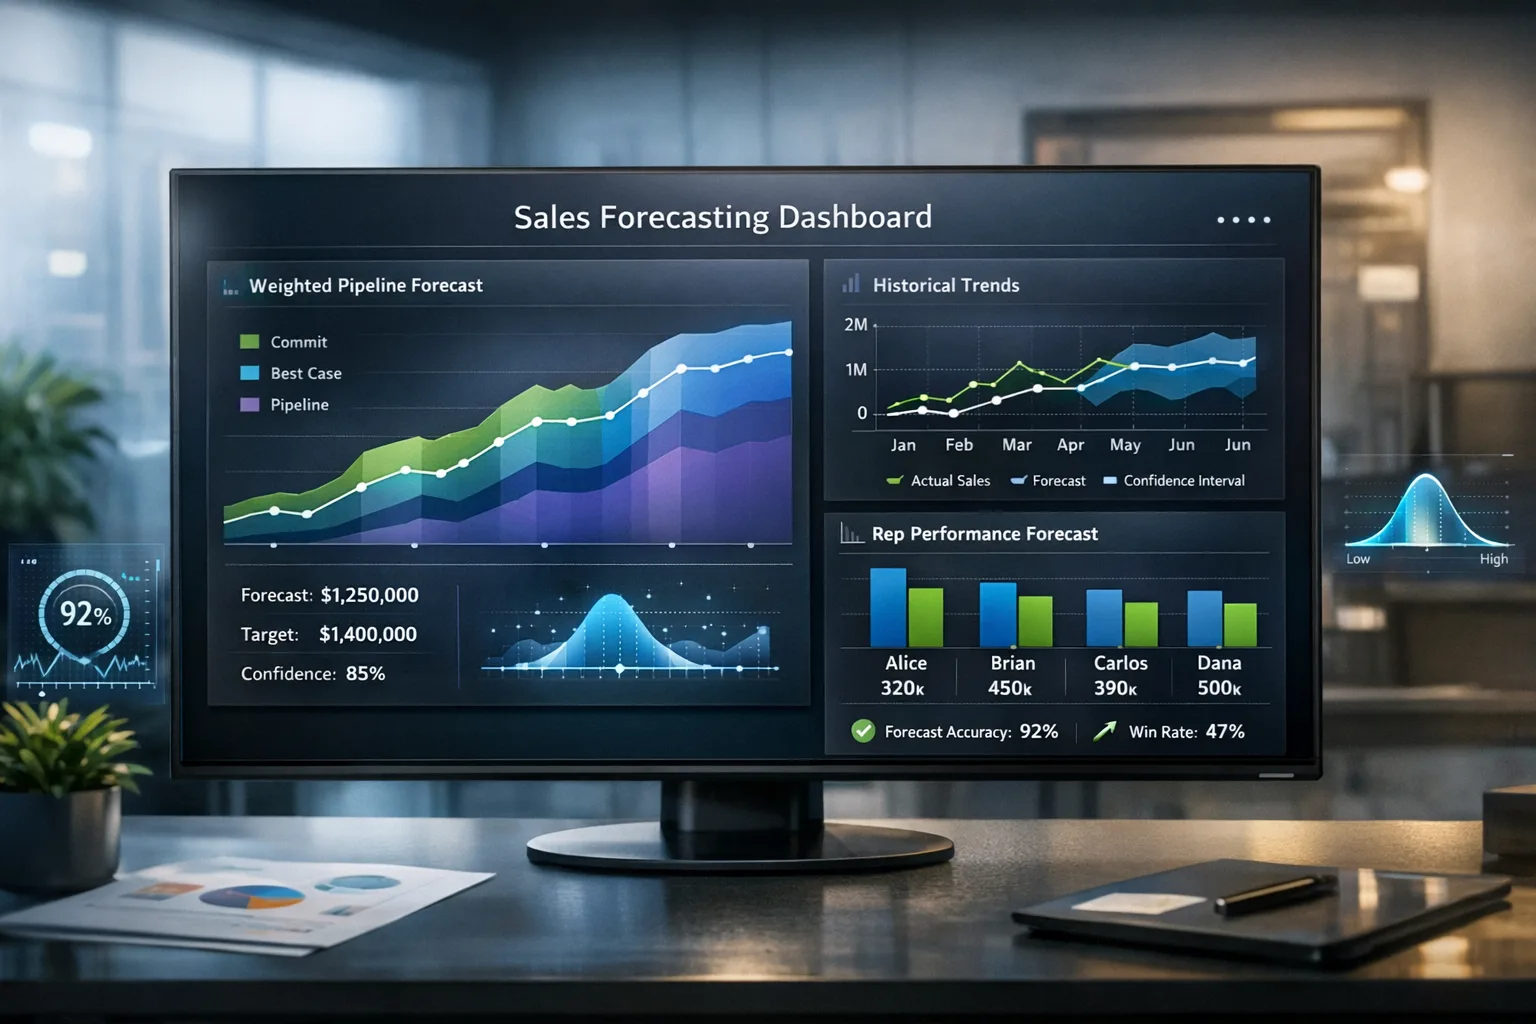
Multi-method forecasting model combining weighted pipeline, historical trends, and rep-level predictions for accurate revenue forecasts.
Template preview
Forecasting model
What's included
Multi-method forecasting model combining weighted pipeline, historical trends, and rep-level predictions for accurate revenue forecasts.
Template specs
Updated 2026-02-20
No credit card · Free forever
A multi-method sales forecasting model that combines three approaches: weighted pipeline (probability-based), historical trend analysis (seasonality-adjusted), and rep-level commitment forecasting. Includes a forecast accuracy tracker and confidence interval calculations. The Excel model runs all three methods on the same input data and shows them side by side with a blended average, so instead of arguing about whose number is right, your forecast call becomes a discussion of why the methods diverge — a weighted pipeline that runs far above the historical trend usually means stage probabilities are inflated, while a rep commit far below both signals sandbagging. A snapshot tab stores each week's prediction against the eventual actual, building the accuracy history that tells you which method to trust for your specific business. Finance teams use the confidence-interval output to set conservative, base, and stretch cases for hiring and spend planning.
The Problem This Solves
Sales forecasts are unreliable because they rely on a single method (usually gut feel). Leaders can't make hiring, spending, or strategy decisions based on inaccurate projections.
Who It's For
VP Sales, CROs, and finance teams responsible for revenue forecasting and planning.
Use Cases
- Generate board-ready forecasts with confidence intervals
- Compare forecast methods to find what's most accurate for your business
- Track forecast accuracy over time to improve prediction quality
How to Use This Template
- 1
Import your pipeline data and historical close rates
- 2
Run all three forecast methods using the built-in formulas
- 3
Compare outputs and select the method with the lowest historical error
- 4
Set up weekly forecast snapshots to track accuracy over time
- 5
Use the blended forecast for board reporting
Inside the template: sample data
The exact rows that ship with the Sales Forecasting Model download — replace them with your own records after import.
| Method | Q1 Forecast | Q1 Actual | Accuracy |
|---|---|---|---|
| Weighted Pipeline | $1.2M | $1.05M | 87.5% |
| Historical Trend | $980K | $1.05M | 93.3% |
| Rep Commitment | $1.1M | $1.05M | 95.2% |
| Blended (avg) | $1.09M | $1.05M | 96.2% |
Frequently Asked Questions
Ready to use this template?
Deploy Sales Forecasting Model in HelloGrowthCRM with one click. Get started free — no credit card · free forever.
Free forever · No credit card required · Set up in minutes
Related resources
Related Templates
CRM Sales Pipeline Template
A universal 7-stage sales pipeline with weighted forecasting, stage probabilities, and automated deal aging alerts.
Enterprise Sales Pipeline
10-stage enterprise pipeline for complex B2B sales cycles of 3-12 months with legal review and procurement stages.
Sales Territory Planning Template
Data-driven territory planning workspace with account import, potential scoring, balance checks, quota planning, and optional performance tracking.